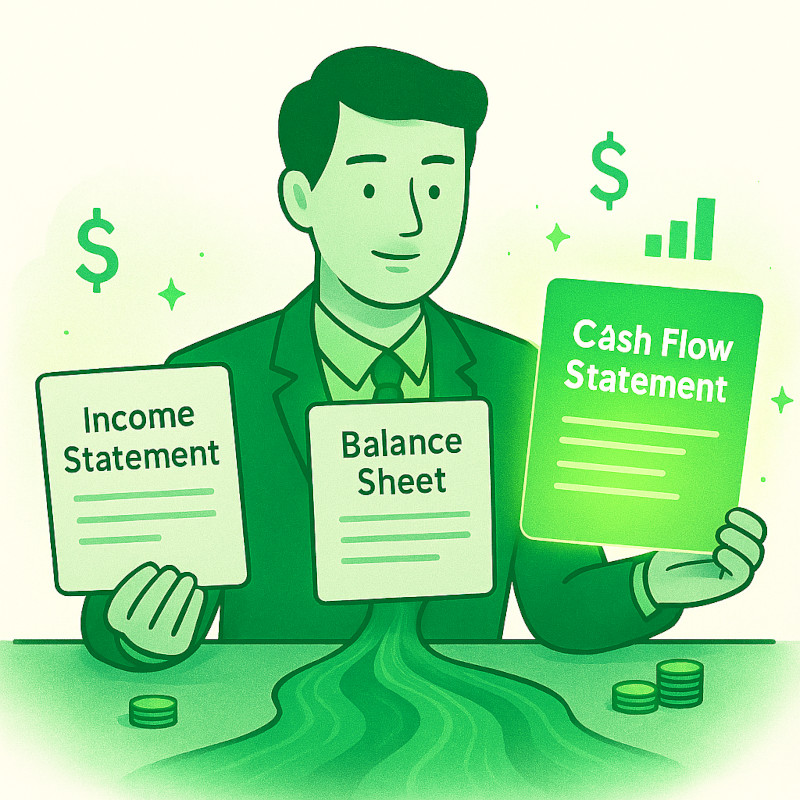
If you have ever stared at your bank balance thinking the business is doing fine, only to discover at year end that you barely broke even, you already understand why the income statement matters. The Profit & Loss report — more formally the income statement — is the financial document that tells you, with unambiguous clarity, whether your business made or lost money over a given period. It is one of the three core financial statements every business produces, alongside the balance sheet and the cash flow statement, and for most SME owners it is the most immediately useful of the three.
What Is an Income Statement (Profit & Loss)?

The income statement — also called the Profit & Loss report, or simply the P&L — is a summary of a company’s revenues and expenses over a specific period, typically a month, a quarter, or a financial year. The end result is either a net profit (income exceeded expenses) or a net loss (expenses exceeded income).
Unlike the balance sheet, which captures the financial position of a business at a single point in time, the income statement covers a period of time. Think of it this way: the balance sheet is a photograph; the income statement is a film reel. One shows you where things stand today; the other shows you how you got there.
For SME owners, the income statement answers the most pressing operational question: are we profitable? It also underpins decisions about pricing, hiring, cost control, and investment — which is why understanding how to read one is an essential skill, not just an accountant’s concern.
The Structure of an Income Statement
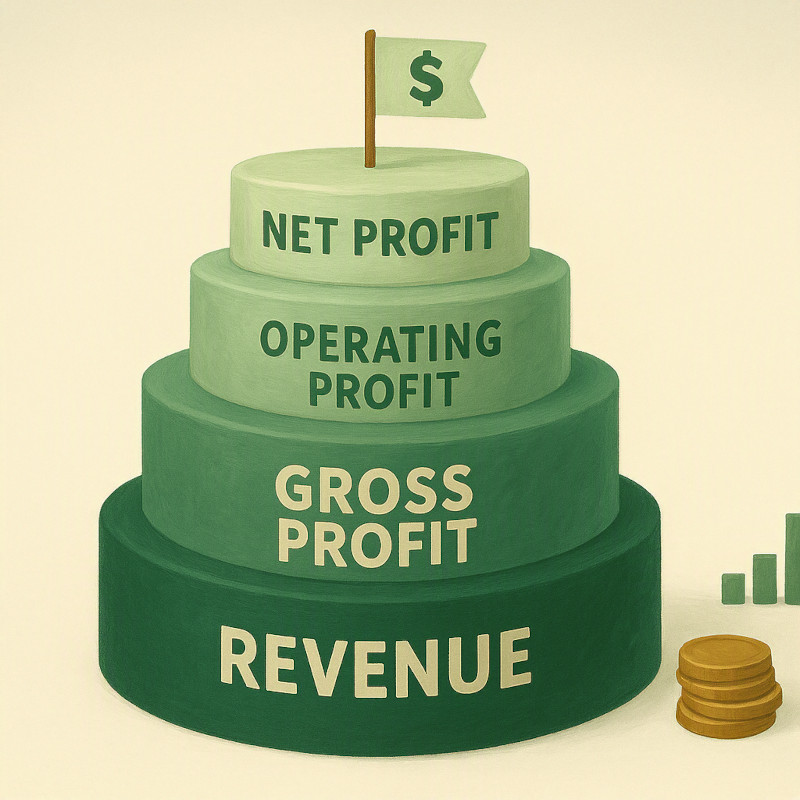
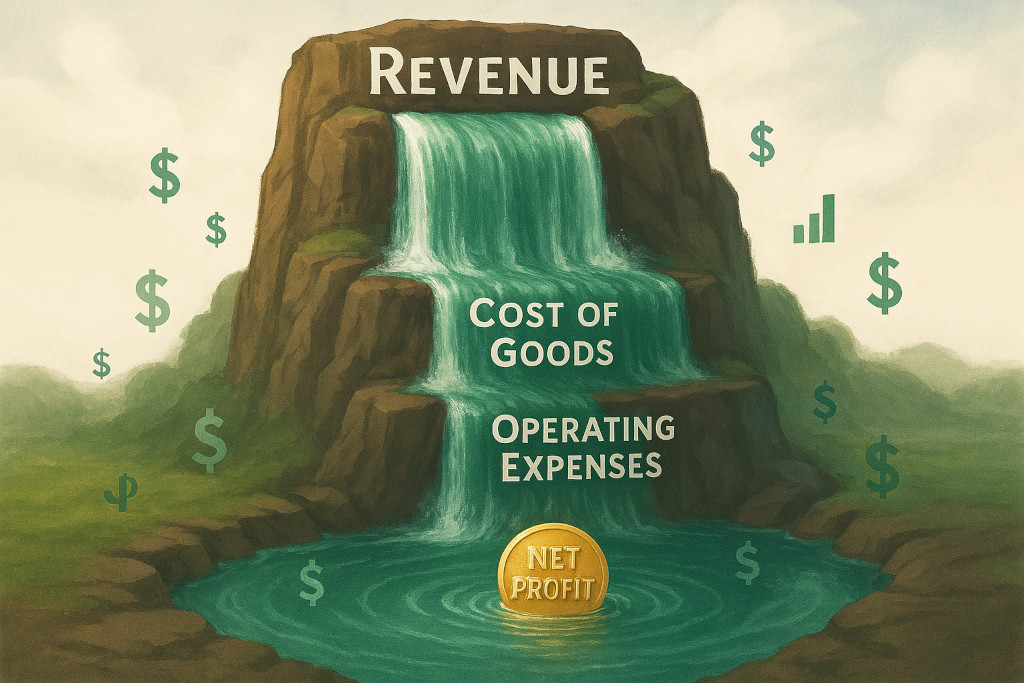
Most income statements follow the same top-to-bottom structure, moving from total revenue down through layers of deductions until a final profit figure is reached. Each layer has a specific name and meaning.
Revenue (Turnover)
Revenue is the total income your business generated from its core trading activities — selling goods, providing services, or both. This is sometimes called “turnover” or “sales”. It is recorded at the top of the statement and is often called the “top line”.
Cost of Goods Sold (COGS) / Cost of Sales
Directly beneath revenue sits the cost of producing what you sold. For a product-based business, this is raw materials, manufacturing costs, and direct labour. For a service business, it might be the direct cost of delivering a project. Subtracting COGS from Revenue gives you Gross Profit.
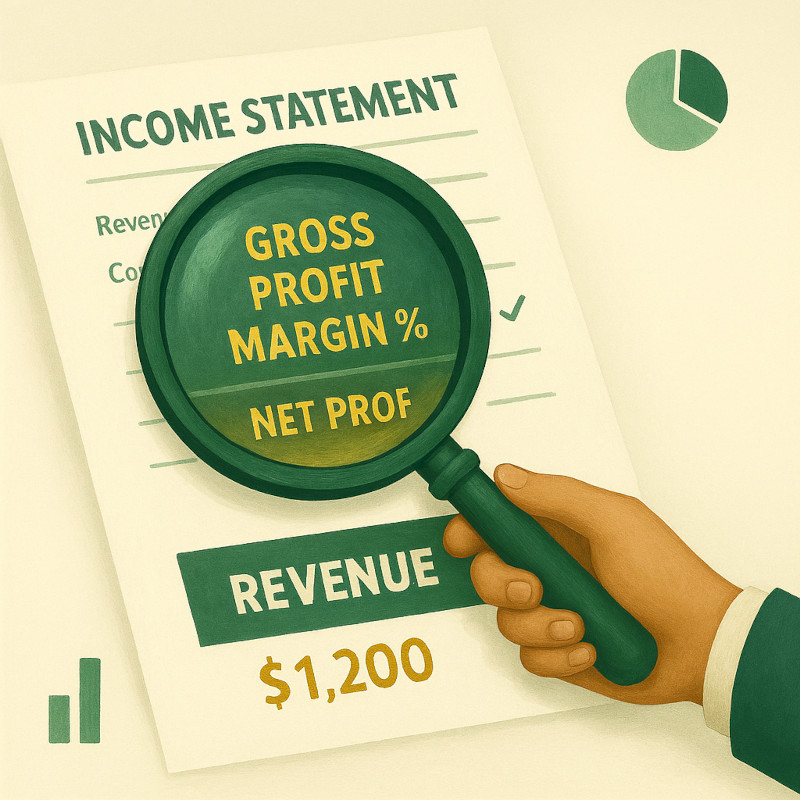
Gross Profit and Gross Margin
Gross profit shows how efficiently you convert revenue into profit before you account for overhead. Gross margin — expressed as a percentage — is one of the most watched metrics in any business:
Gross Margin % = (Gross Profit ÷ Revenue) × 100
Operating Expenses
Also called overheads, these are costs that keep the business running but are not directly tied to producing individual units of revenue. Rent, salaries, marketing, software subscriptions, and utilities are common examples. Subtracting these from Gross Profit gives you Operating Profit (also called EBIT — Earnings Before Interest and Tax).
Interest and Tax
Below operating profit, you deduct interest on any debt the business carries, and then corporation tax (or income tax in a sole trader context). The result is Net Profit — the much-discussed “bottom line”.
| Line Item | Example (£) | What It Tells You |
|---|---|---|
| Revenue | 500,000 | Total sales generated in the period |
| Cost of Goods Sold | (200,000) | Direct cost of products/services sold |
| Gross Profit | 300,000 | Profit before overheads (60% gross margin) |
| Operating Expenses | (180,000) | Salaries, rent, marketing, admin |
| Operating Profit (EBIT) | 120,000 | Profit from trading before interest & tax |
| Interest Expense | (10,000) | Cost of business borrowing |
| Tax | (27,500) | Corporation tax at 25% |
| Net Profit | 82,500 | What the business ultimately earned |
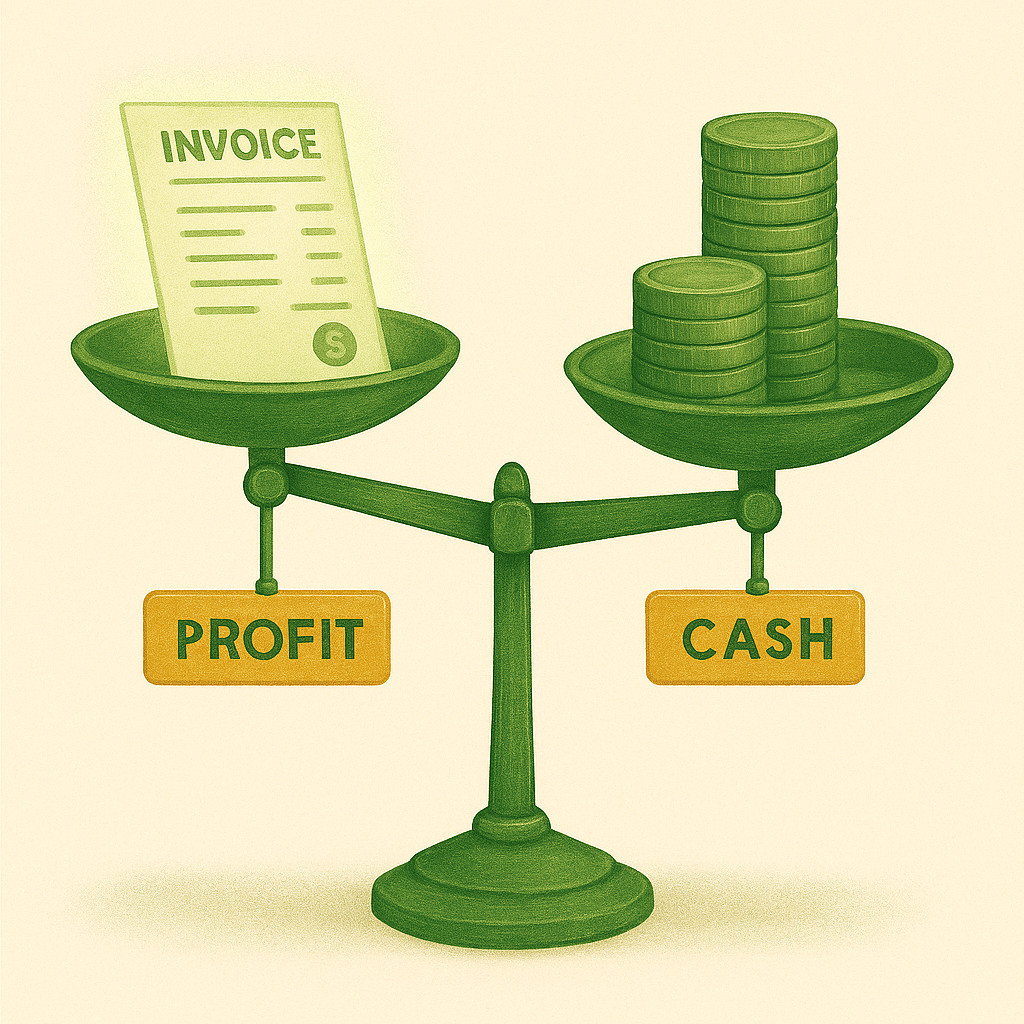
The income statement does not tell you how much cash the business has in the bank — it tells you how much value it created. A business can be highly profitable on paper yet still run out of cash. That is why the P&L and the cash flow statement must always be read together.
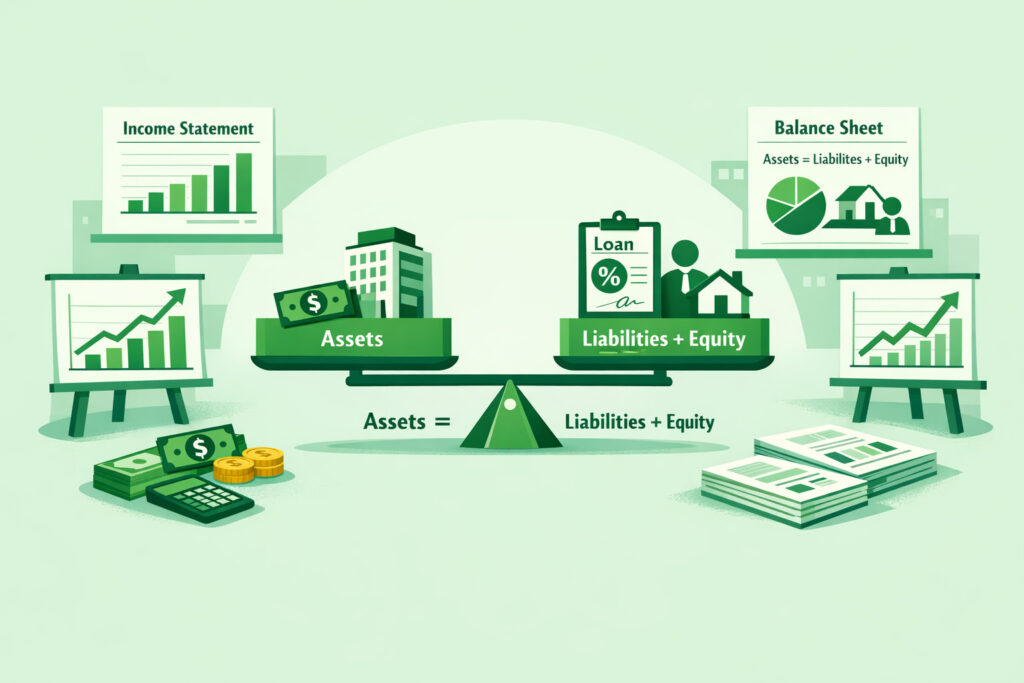
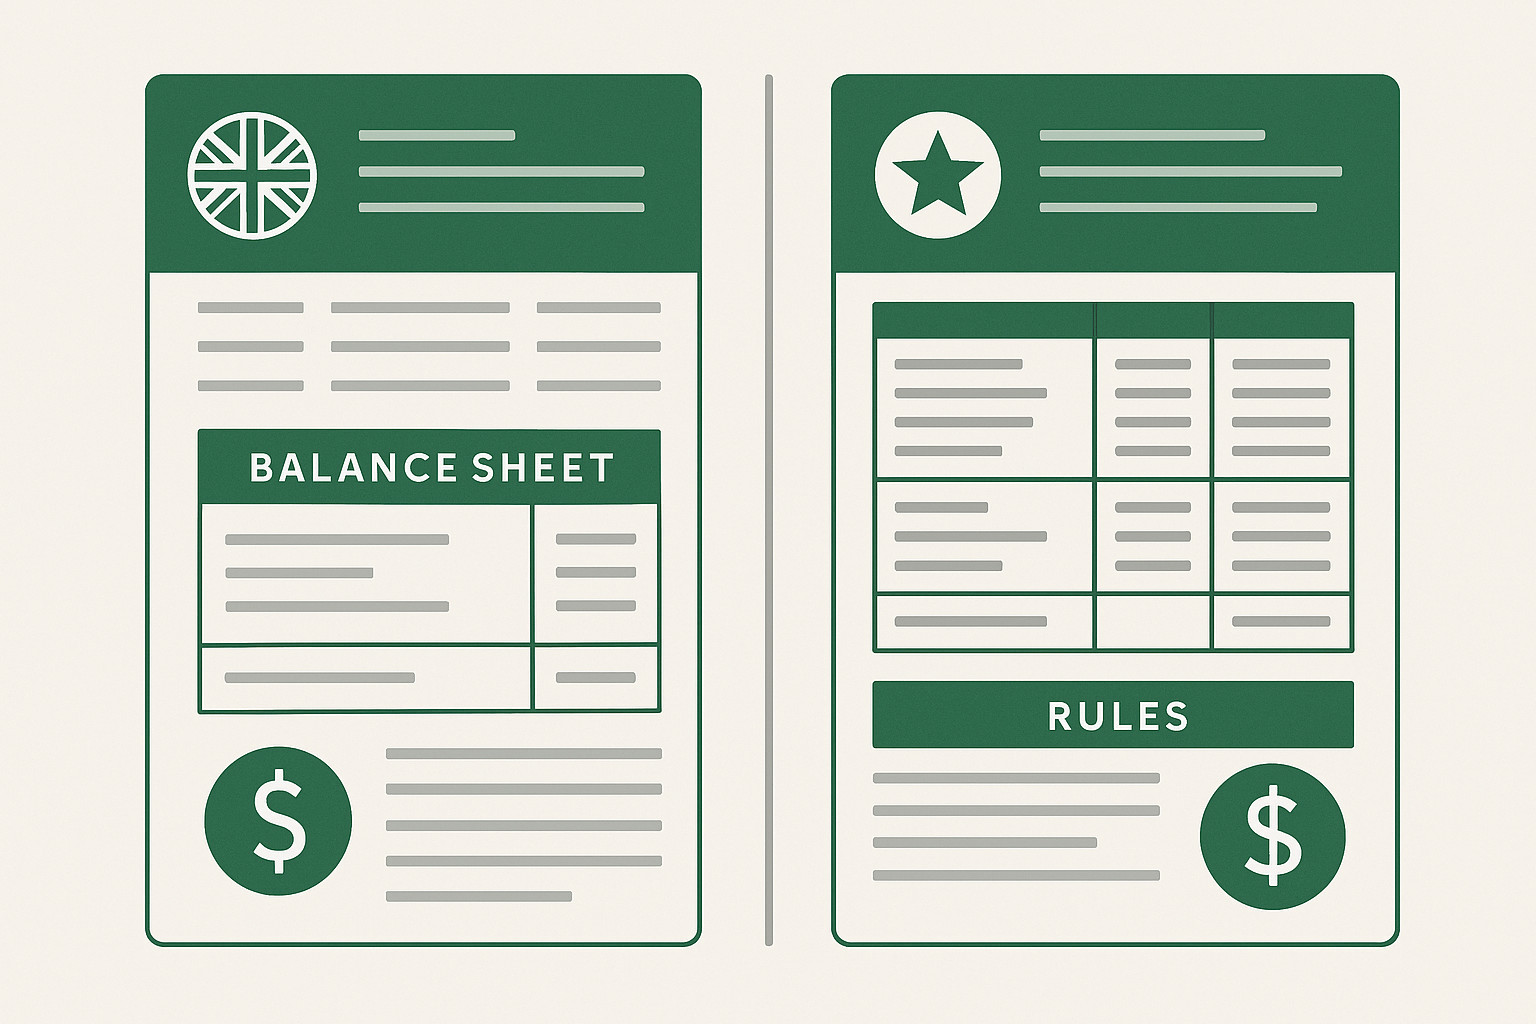
Income Statement vs Balance Sheet: What’s the Difference?
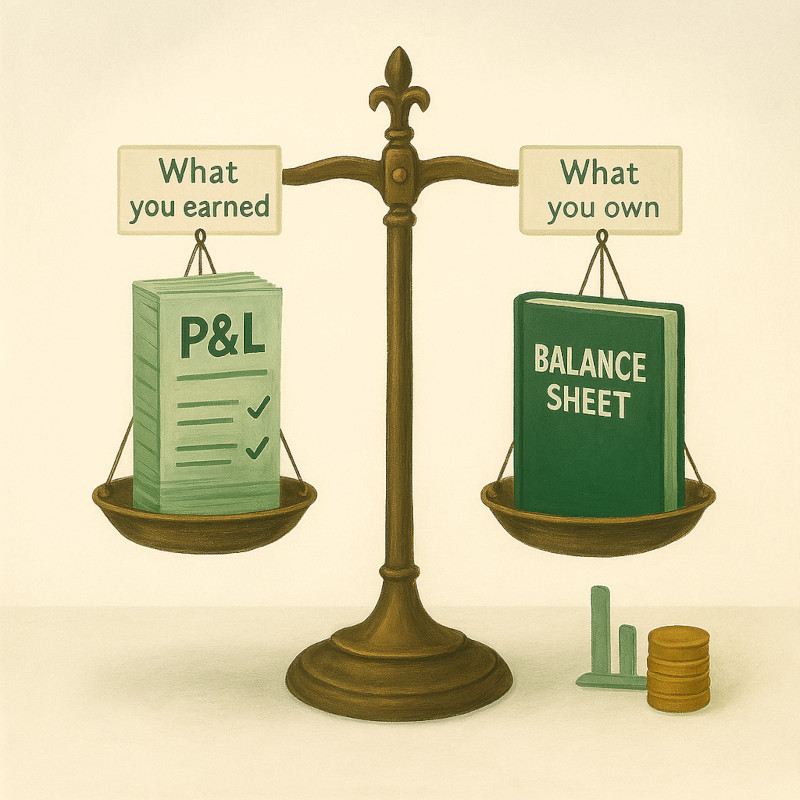
One of the most common sources of confusion for new business owners is the relationship between the income statement and the balance sheet. They report different things and serve different purposes, but they are deeply connected.
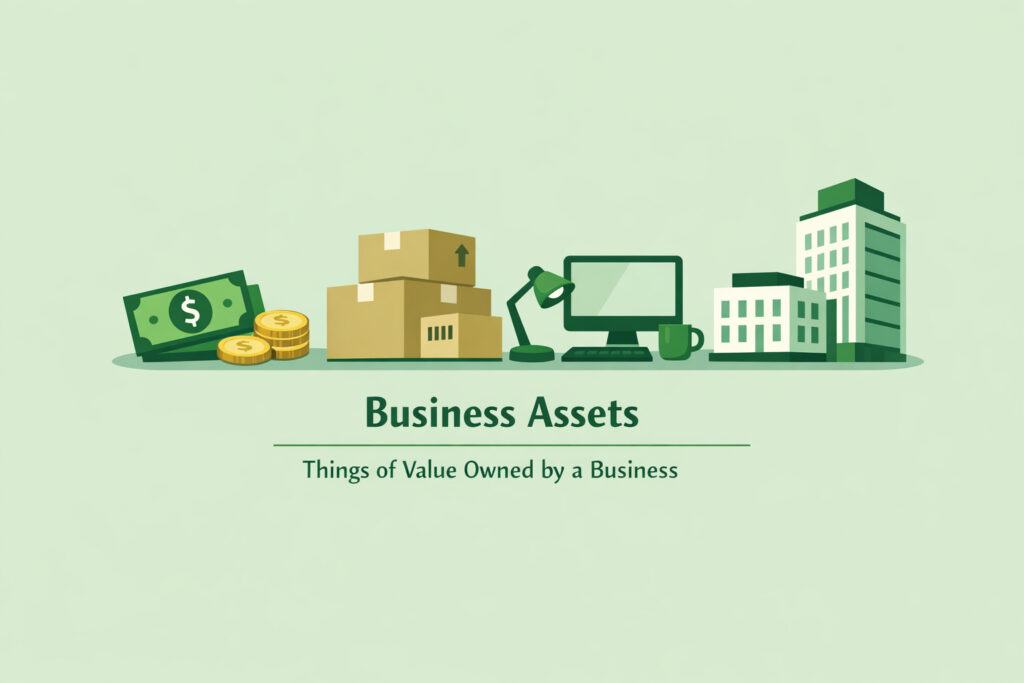
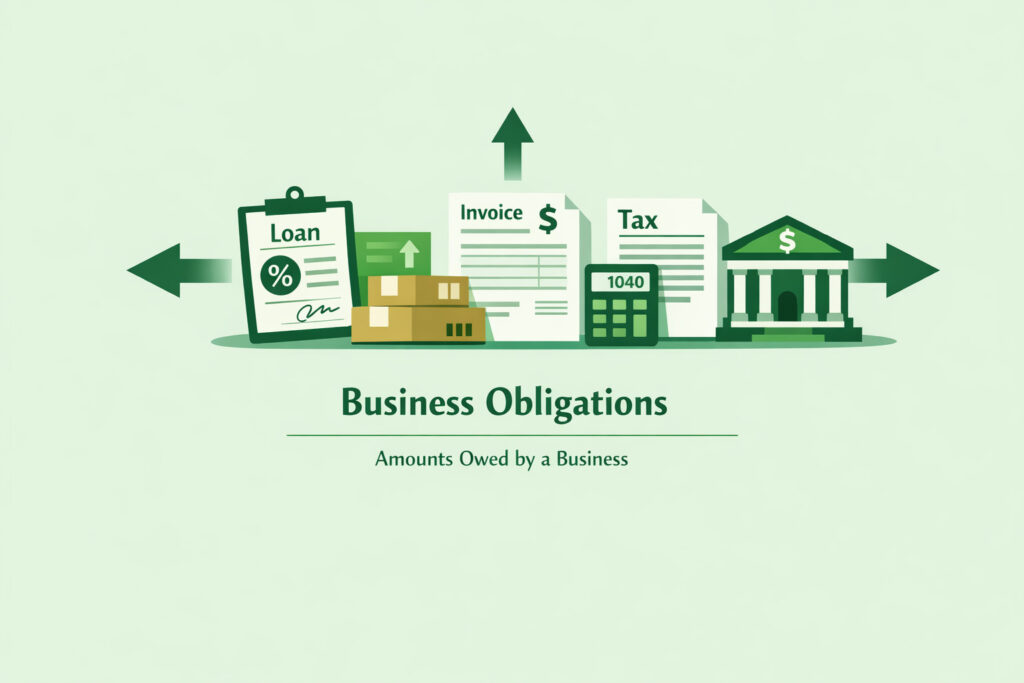
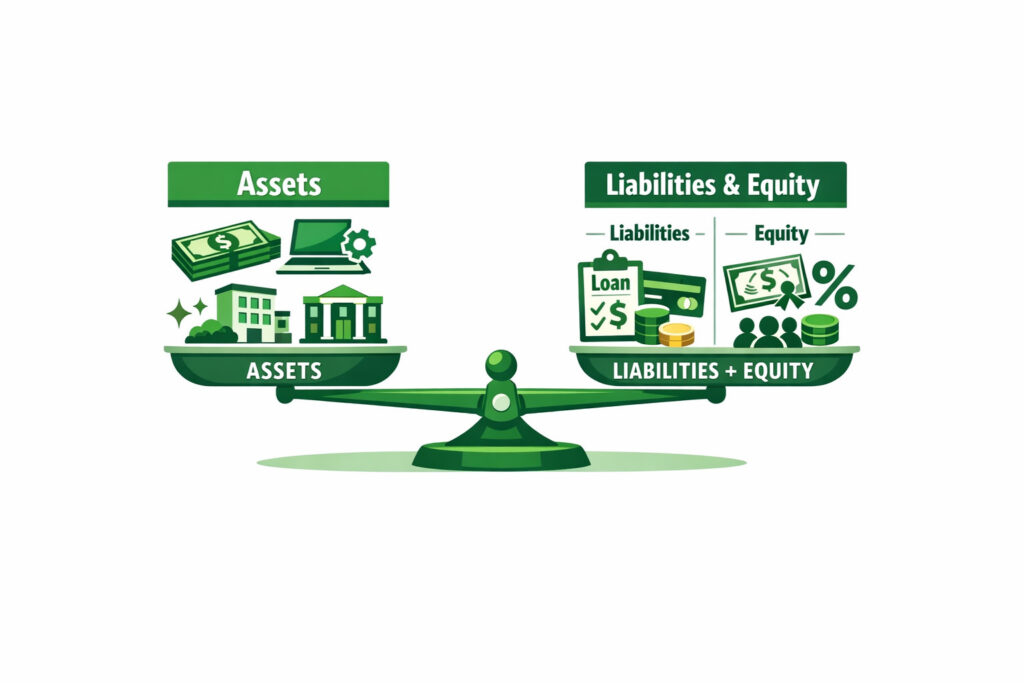
The balance sheet shows what your business owns (assets) and owes (liabilities) at a specific date, with the difference being equity. The income statement shows what your business earned and spent over a period of time. The connection between them is this: the net profit from the income statement flows directly into retained earnings on the balance sheet, increasing owner’s equity.
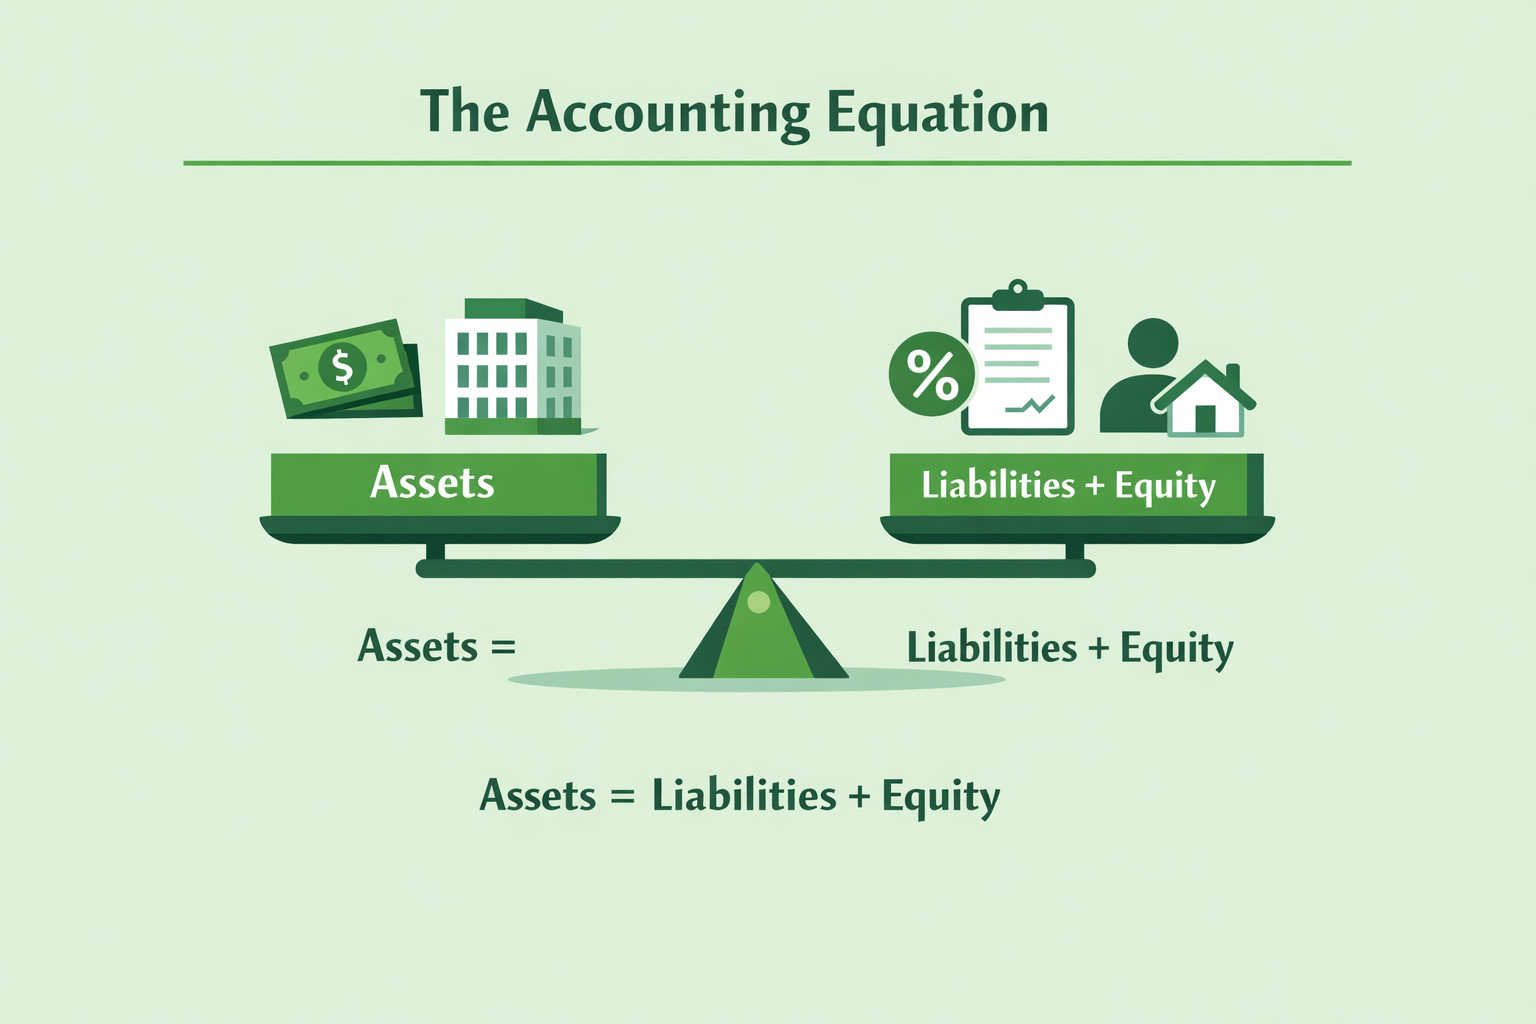
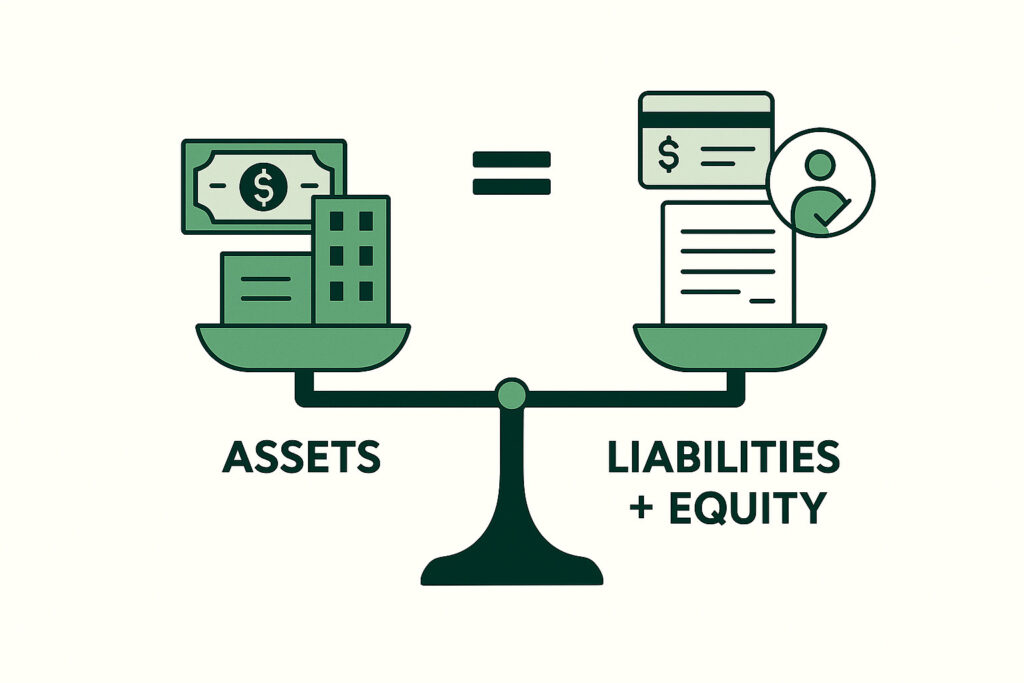
If the accounting equation — Assets = Liabilities + Equity — is new to you, the Accounting Equation Explained article on this site is an excellent starting point for understanding how the P&L feeds into the wider financial picture.
For group companies with multiple subsidiaries, the picture becomes more complex: the income statement of each entity must be consolidated, and intra-group transactions — such as one subsidiary selling services to another — must be eliminated to avoid double-counting revenue. BrizoConsol’s guide on why intercompany transactions are eliminated in financial consolidation covers this in practical detail for anyone managing a multi-entity structure.
How to Read and Analyse Your P&L
Reading the bottom line is only the beginning. The real value of the income statement comes from tracking ratios and trends over time.
Key ratios to watch
- Gross Margin % — measures how efficiently you produce revenue. A falling gross margin over several periods suggests either rising costs or pricing pressure.
- Operating Margin % — Operating Profit ÷ Revenue. Shows how well the business controls overheads relative to revenue.
- Net Profit Margin % — Net Profit ÷ Revenue. The truest measure of overall profitability after all deductions.
- Expense Ratios — individual overhead categories as a percentage of revenue (e.g. staff costs ÷ revenue). Useful for spotting where costs are creeping up.
Comparative analysis
A single month’s P&L in isolation tells you relatively little. The power comes from comparison: this month vs last month, this quarter vs the same quarter last year, or actual results vs budget. Most accounting software will produce a comparative P&L automatically — the habit of reviewing it regularly is what converts raw numbers into actionable decisions.
When your income statement is looking healthy but cash is still tight, the issue usually lies in the timing of when money moves — receivables, payables, or stock. The cash flow statement guide on Accounting Reports Daily explains exactly how to reconcile the gap between profit and cash.
Common Income Statement Mistakes SMEs Make
Even with good accounting software, a few persistent errors can distort the picture your income statement is painting.
- Mixing capital and revenue expenditure. Buying a piece of equipment is not an operating expense — it is a capital asset. Recording it as an expense in the P&L overstates costs and understates profit in the period.
- Recording revenue too early. Under accruals accounting, revenue is recognised when it is earned — when goods are delivered or services rendered — not when cash is received. Recognising revenue early inflates profit in the wrong period.
- Ignoring accruals and prepayments. If you pay your annual insurance premium in January, only one-twelfth of that cost belongs in each month’s P&L. Failing to spread costs correctly creates lumpy, misleading results.
- Not reconciling to the bank. It is surprisingly easy for transactions to be miscoded, omitted, or duplicated. A monthly bank reconciliation catches errors before they compound.
- Reviewing only once a year. The income statement is most useful as a management tool when reviewed monthly. Annual reviews are too slow to catch problems while there is still time to act.
For SMEs that operate across multiple entities or jurisdictions, there is a further complexity: ensuring that the chart of accounts — the taxonomy of every revenue and expense category — is consistently structured. BrizoConsol’s detailed guide on how to design a common chart of accounts for multi-entity groups is a practical resource for finance teams trying to produce comparable P&Ls across the group.
Key Takeaways
- The income statement (Profit & Loss report) summarises revenue, expenses, and profit over a specific period — it is a film reel, not a photograph.
- It flows from Revenue → Gross Profit → Operating Profit → Net Profit, with each line revealing a different layer of performance.
- Gross margin, operating margin, and net profit margin are the three ratios to track consistently over time.
- The P&L connects to the balance sheet through retained earnings: net profit increases owner’s equity.
- Profit on the income statement is not the same as cash in the bank — always read the P&L alongside the cash flow statement.
- Common errors include mixing capital and revenue expenditure, recognising revenue too early, and failing to accrue costs correctly.
- Monthly review, not annual, is what makes the income statement genuinely useful as a management tool.
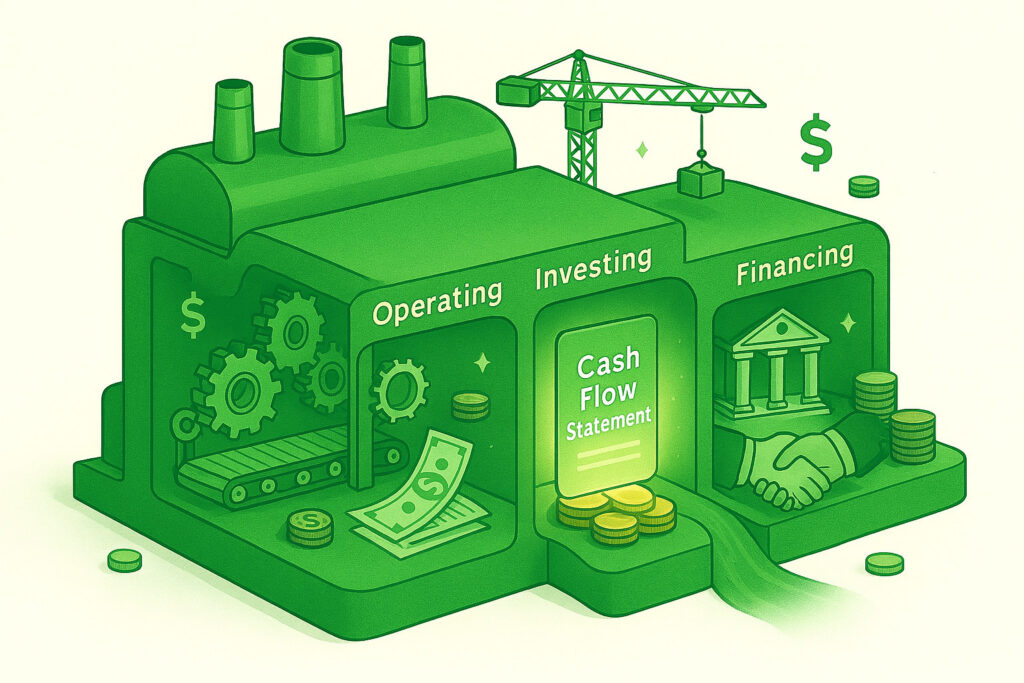
Related reading: For a deeper understanding of how the income statement sits within the full set of financial statements, see our guides on the Balance Sheet: Structure and Key Elements, Understanding the Cash Flow Statement, and Cash Flow Forecasting for SMEs.