Tag: Management Reporting

  • The Finance KPIs Every SME Should Track: A Practical Guide to Measuring What Matters

    The Finance KPIs Every SME Should Track: A Practical Guide to Measuring What Matters

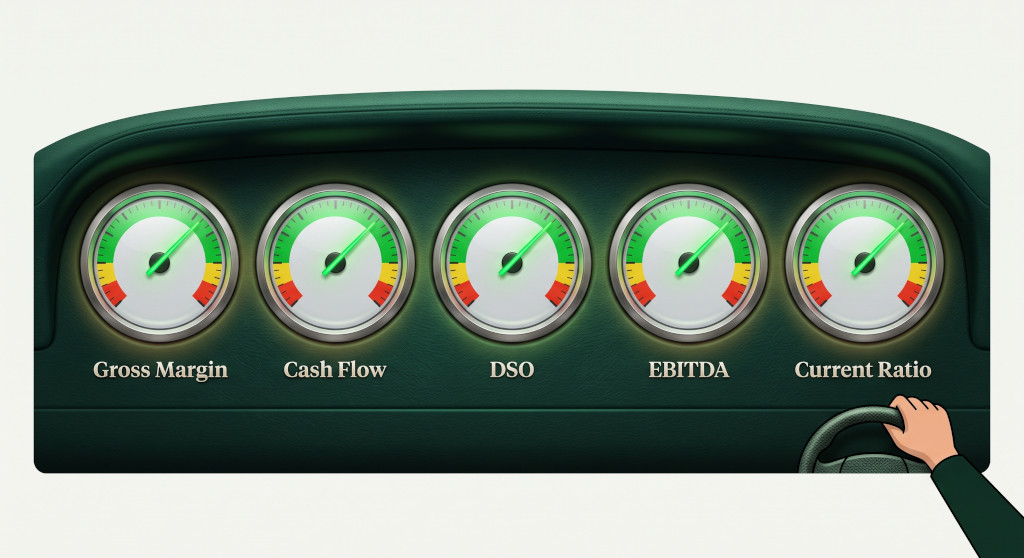
    Numbers without context are just data. A revenue figure of £80,000 in March means very little on its own — was it a good month or a bad one? Is the business growing or contracting? Is the margin healthy or is the bottom line being quietly eaten by costs? Key performance indicators (KPIs) are the answer to these questions. They convert raw financial data into signals: green means the business is performing as intended, amber means something deserves attention, red means action is required. For SME owners and finance teams, a small set of well-chosen KPIs — reviewed consistently each month — is one of the most powerful management tools available. This guide covers which KPIs matter most, what each one tells you, and how to bring them together into a monthly finance dashboard you can actually use.

    Why KPIs Beat Gut Instinct

    Every experienced business owner develops a feel for how the business is doing. That intuition is genuinely valuable — but it has blind spots. It tends to focus on the areas you know best, overlook slow-moving problems, and struggle to separate temporary noise from structural trends. KPIs do not replace judgment; they sharpen it.

    A well-designed KPI set catches things you might not notice until they become serious: a gradual rise in how long customers take to pay, an overhead ratio creeping up quarter by quarter, a gross margin drifting down as costs rise faster than prices. None of these are dramatic events — they are slow-burn patterns that only become visible when you measure them consistently over time and compare them against a target or prior period.

    The other benefit of KPIs is communication. When the same numbers are reviewed by the whole management team every month, everyone is working from the same picture. Disagreements about performance become factual rather than political. Priorities are easier to set. And when the business brings in external investors or lenders, a coherent KPI framework signals that management knows what it is doing.

    The Core Profitability KPIs

    Profitability KPIs measure whether the business is converting revenue into profit — and at what rate. For SMEs, three margins deserve monthly attention.

    Gross profit margin. This is revenue minus the direct costs of delivering your product or service (cost of goods sold), expressed as a percentage of revenue. It tells you how efficiently the business converts sales into profit before fixed overhead costs are applied. A falling gross margin is one of the earliest warning signs that input costs are rising, pricing is under pressure, or the revenue mix is shifting towards lower-margin work. Track it by product line or service category if you can — aggregate margins can hide a lot.

    Formula: (Revenue − Cost of Sales) ÷ Revenue × 100

    Operating profit margin. This is gross profit minus operating overheads (salaries, rent, software, marketing), expressed as a percentage of revenue. It tells you how much profit the business generates from its core operations before interest and tax. For most SMEs, the operating margin is the headline profitability KPI — it reflects both pricing efficiency and cost discipline together.

    Formula: Operating Profit ÷ Revenue × 100

    Net profit margin. This takes operating profit and also deducts interest costs, tax, and any exceptional items. It is the bottom line — what the business actually keeps from every pound of revenue. For debt-free SMEs, the net margin and operating margin will be close. For businesses carrying significant borrowing, the gap between the two is worth watching carefully.

    Formula: Net Profit ÷ Revenue × 100

    Gross margin tells you about your pricing and direct cost efficiency. Operating margin tells you about your overall business model. Net margin tells you what actually hits the bank. All three matter — but if you only have time for one, watch gross margin most closely. Problems there work their way through every line below it.

    Cash and Liquidity KPIs

    A business can be profitable on paper and still run out of cash. Cash KPIs measure how quickly money flows through the business and whether the balance sheet has enough liquidity to operate safely. These are the KPIs that matter most to your bank and to your own peace of mind.

    Days Sales Outstanding (DSO). DSO measures how long, on average, it takes customers to pay after being invoiced. A DSO of 30 means customers pay in about a month; a DSO of 60 means they take two months. The higher your DSO, the more cash is tied up in unpaid invoices — and the more pressure on your working capital. Track DSO monthly and compare it to your standard payment terms. If it is consistently higher than your terms, your collections process needs attention.

    Formula: (Trade Receivables ÷ Revenue) × Number of Days in the Period

    Days Payable Outstanding (DPO). DPO measures how long your business takes to pay its own suppliers. A higher DPO means you are holding onto cash for longer before it goes out — which improves your cash position but can strain supplier relationships if taken too far. A good target is to pay suppliers in line with agreed terms: not so fast that you surrender cash unnecessarily, not so slow that you damage key relationships.

    Formula: (Trade Payables ÷ Cost of Sales) × Number of Days in the Period

    Cash conversion cycle (CCC). The CCC combines DSO, DPO, and inventory days (if you hold stock) into a single number that shows how long cash is tied up in the operating cycle before it is collected. A shorter CCC means the business generates cash faster. A lengthening CCC is a warning sign — it means the business is consuming more working capital even if profits look healthy. For a deeper dive into managing working capital components, our guide to working capital management for SMEs covers each lever in detail.

    Formula: DSO + Inventory Days − DPO

    Current ratio. This is current assets divided by current liabilities. A ratio above 1.0 means the business has more short-term assets than short-term obligations — a basic sign of liquidity health. Most SME lenders and accountants look for a current ratio of at least 1.2 to 1.5. A ratio falling below 1.0 is a red flag that warrants immediate attention.

    Formula: Current Assets ÷ Current Liabilities

    Efficiency and Growth KPIs

    Beyond profitability and cash, a small set of efficiency KPIs helps SME owners understand whether the business is using its resources — people, capital, overhead — productively.

    Revenue per employee. This simple metric divides total revenue by the number of full-time equivalent employees. It is a rough but useful indicator of workforce productivity. An improving revenue-per-employee figure suggests the team is becoming more efficient or the business is growing faster than it is hiring. A declining figure may signal that headcount has outpaced revenue growth — a common early sign of cost pressure.

    Overhead ratio. Operating overheads as a percentage of revenue tells you how much of every pound of sales is consumed by fixed costs before a penny of operating profit is made. For most SMEs, keeping the overhead ratio stable or declining as revenue grows is a sign of operating leverage — the business is scaling without proportionally scaling its cost base.

    Revenue growth rate. Year-on-year or month-on-month revenue growth is the most intuitive growth KPI. Compare it against your budget to assess whether growth is on track, and against a simple industry benchmark if one is available. Consistency matters as much as the rate — lumpy, unpredictable revenue growth is harder to manage than steady, compounding growth even if the averages look similar.

    Building a Simple KPI Dashboard

    The most useful KPI dashboard is one that a busy owner or finance lead can scan in two minutes and immediately understand the health of the business. That means a small number of metrics, clear targets, and a simple RAG (Red / Amber / Green) status for each. Here is an example monthly dashboard for a professional services SME:

    KPITargetThis MonthLast MonthStatusNote
    Gross profit margin≥ 72%69.4%71.8%🔴 RedSubcontractor costs up in June — review pricing
    Operating profit margin≥ 28%30.1%29.6%🟢 GreenOn track — overhead efficiencies holding
    Revenue growth (YoY)≥ 15%18.3%16.1%🟢 GreenStrong retainer renewals driving growth
    Days Sales Outstanding≤ 35 days41 days38 days🟠 AmberTwo large invoices delayed — chase this week
    Current ratio≥ 1.41.61.5🟢 GreenComfortable — no liquidity concern
    Overhead ratio≤ 42%39.3%42.2%🟢 GreenRevenue growth outpacing fixed cost base
    Revenue per employee≥ £12,500/mo£13,100£12,700🟢 GreenImproving — no new hires in period

    A dashboard like this requires less than an hour to populate each month if your management accounts are current. The power is not in any single figure — it is in the pattern across figures. In the example above, the red gross margin flags a specific cost issue that needs investigation, while the amber DSO flags a near-term cash action. Everything else is green: a clear signal to management that the business is broadly healthy and two specific areas need attention this week.

    As businesses grow and operate across multiple entities, the discipline of KPI reporting scales up accordingly. BrizoConsol’s guide on building deeper group-level insights into financial dashboards covers how consolidated KPI views work when a business has subsidiary entities each contributing to the group picture.

    How Often Should You Review KPIs — and Who Should See Them?

    For most SMEs, monthly is the right rhythm for a full KPI review — frequent enough to catch problems early, not so frequent that you are reacting to noise rather than signal. A few KPIs (particularly DSO and cash balance) may warrant a weekly or even daily glance, especially during tight cash periods or rapid growth phases.

    Ownership matters as much as frequency. Each KPI should have a named owner — the person accountable for both reporting the number and explaining it when it is off target. Without ownership, KPI reviews tend to become passive observation exercises rather than management conversations that drive action.

    Who should see the dashboard? At minimum: the business owner, the finance lead, and any department heads with responsibility for a KPI line. For transparency-focused cultures, sharing a simplified version with the whole senior team tends to accelerate accountability and alignment. The more people understand how the business measures its own performance, the more they can contribute to improving it.


    Key Takeaways

    • A small, consistent set of finance KPIs is more valuable than a large, inconsistently reviewed set. Six to ten well-chosen metrics, tracked monthly with clear targets, beat a 40-line report reviewed quarterly.
    • The core profitability KPIs — gross margin, operating margin, and net margin — should anchor every SME finance dashboard. Gross margin is the earliest indicator of pricing and cost efficiency.
    • Cash KPIs (DSO, DPO, current ratio, cash conversion cycle) are the most operationally urgent metrics. A profitable business can still fail if cash is not managed actively.
    • Days Sales Outstanding is one of the single most actionable KPIs for SMEs. A rising DSO can be addressed directly through improved invoicing and collections processes.
    • Build a RAG-status dashboard — Red, Amber, Green against each KPI target — so the health of the business can be read at a glance and management attention goes where it is needed most.
    • Assign a named owner to each KPI. Numbers without accountability become wallpaper.
    • Review monthly as a minimum. For cash KPIs during tight periods, weekly monitoring is warranted.

    Related reading: Finance KPIs work best when they are connected to a broader financial management system. Our guides on key financial ratios explainedbudgeting and forecasting for SMEsworking capital management, and understanding the income statement all connect directly to the KPIs covered here.

  • The Essential KPIs Every Finance Team Should Be Tracking

    The Essential KPIs Every Finance Team Should Be Tracking

    Most finance teams track too many numbers and act on too few. A spreadsheet packed with 40 metrics sounds thorough; in practice it means nobody knows which three things actually matter this month. Key Performance Indicators — KPIs — only earn that name when they are genuinely used to drive decisions. The best finance KPI frameworks are selective, consistent, and tied directly to the questions leadership needs answered: Are we profitable enough? Do we have enough cash? Are we collecting what we’re owed? This guide covers the essential financial KPIs worth tracking, what each one tells you, how to calculate it, and how to build a simple dashboard your team will actually use.

    What Makes a Good Financial KPI?

    Before choosing which KPIs to track, it helps to know what separates a genuinely useful metric from one that simply fills a report. A good financial KPI has four characteristics:

    1. It answers a decision-relevant question. “Revenue” is a fact. “Revenue vs budget” is a KPI — it answers whether you are on track. The question it answers should be one that someone in the business needs answered regularly.
    2. It can be calculated consistently. A metric defined differently each month — or that requires significant judgement to produce — will generate arguments rather than insight. KPIs should have clear, agreed formulas.
    3. It moves. A ratio that has been 48% for three years is background information, not a KPI. Good KPIs change enough over a monthly or quarterly cycle to be worth monitoring.
    4. Someone owns it. Every KPI should have a named person responsible for its accuracy and for investigating when it moves unexpectedly. Unowned KPIs go stale.

    Key insight: Five KPIs that are reviewed every month and acted upon are worth more than twenty that appear in a report nobody reads. When designing your finance KPI framework, start by asking: “If I could only know three things about this business’s financial health each month, what would they be?” Build from there.

    The Essential Finance KPIs: A Complete Reference

    The table below covers the core financial KPIs that most SME finance teams should consider. They are grouped by theme — profitability, cash and liquidity, and efficiency — to make it easier to select the subset most relevant to your business.

    KPIFormulaWhat It Tells YouWatch Out When…
    Gross Margin %(Revenue − Cost of Sales) ÷ Revenue × 100How much of each pound of revenue survives after direct costs. The most fundamental profitability indicator.It is trending down — usually means pricing pressure, rising input costs, or a shift in product/service mix.
    EBITDA Margin %EBITDA ÷ Revenue × 100 (EBITDA = Operating profit before depreciation & amortisation)Operating profitability before non-cash charges. Used widely for valuation and lender covenants.It diverges significantly from operating profit margin — may indicate heavy depreciation or amortisation worth scrutinising.
    Net Profit Margin %Net Profit ÷ Revenue × 100Overall bottom-line profitability after all costs, interest, and tax.It is healthy but gross margin is weak — overheads may be masking a core pricing problem.
    Revenue vs Budget(Actual Revenue − Budgeted Revenue) ÷ Budgeted Revenue × 100Whether top-line growth is on plan. The most direct measure of commercial performance vs expectation.It consistently misses — your budget assumptions may need revisiting, or a sales/pricing issue needs addressing.
    Current RatioCurrent Assets ÷ Current LiabilitiesShort-term liquidity — whether the business can meet its near-term obligations. A ratio above 1.0 is the minimum; above 1.5 is generally healthy.It falls below 1.2 — the business may struggle to meet obligations without additional financing.
    Quick Ratio(Current Assets − Inventory) ÷ Current LiabilitiesA tighter liquidity test that excludes inventory, which may not be quickly convertible to cash.It is significantly lower than the current ratio for a product business — inventory levels may be too high.
    Debtor Days (DSO)(Accounts Receivable ÷ Revenue) × 365How long, on average, customers take to pay. Compare against your standard payment terms.It exceeds your payment terms — customers are paying late and cash flow is being squeezed.
    Creditor Days (DPO)(Accounts Payable ÷ Cost of Sales) × 365How long, on average, you take to pay suppliers. Healthy when longer than debtor days.It falls much lower than debtor days — you are paying suppliers faster than customers pay you, creating a cash gap.
    Cash Conversion CycleDebtor Days + Inventory Days − Creditor DaysThe number of days cash is tied up in the operating cycle. Lower is better — negative means the business is funded by its suppliers.It is rising — more working capital is being consumed, which may require financing even in a profitable business.
    Operating Cash Flow RatioOperating Cash Flow ÷ Current LiabilitiesWhether the business generates enough cash from operations to cover its short-term obligations — a real-cash complement to the current ratio.It is below 1.0 consistently — the business is not self-funding and relies on external sources to meet obligations.
    Overhead RatioTotal Overheads ÷ Revenue × 100The proportion of revenue consumed by fixed costs. Useful for tracking cost discipline as revenue scales.Revenue grows but the overhead ratio does not fall — fixed costs are not being leveraged.
    Revenue per EmployeeTotal Revenue ÷ Number of EmployeesA simple productivity metric. More useful when tracked as a trend than as a single point-in-time figure.It falls as headcount grows — new hires may not yet be generating proportionate output, or the business model is becoming less scalable.

    Not all of these will be equally relevant to every business. A product business with significant inventory should watch the cash conversion cycle closely. A professional services firm with no inventory may never need it — but will care intensely about debtor days and revenue per employee. Choose the six to eight that reflect your actual business model and ignore the rest.

    Profitability KPIs: Reading the Margin Stack

    Profitability KPIs work best when read as a stack — from gross margin down to net profit margin — rather than in isolation. Each level of the income statement strips away another layer of cost, and the pattern of where margin is lost tells you where to focus.

    If gross margin is healthy but net margin is thin, the problem is in overheads — staff costs, rent, or administration are consuming the profit that the core business generates. If gross margin is low, no amount of overhead control will save you: the core economics of the product or service need to change. This is why gross margin is the single most important profitability KPI for most businesses, and why tracking it monthly — not just annually — is essential. Our guide to understanding the income statement explains how each layer of the P&L fits together.

    EBITDA is worth tracking alongside operating profit because it removes the distorting effect of depreciation — particularly relevant if your business carries significant fixed assets or has recently made acquisitions. Lenders and investors typically use EBITDA multiples for valuation, so keeping an eye on it gives you a sense of how your business would be assessed externally.

    Cash Flow and Efficiency KPIs: The Liquidity Picture

    A business can show strong profitability on the income statement while simultaneously running out of cash — a situation that surprises many first-time business owners but is entirely predictable once you understand working capital. The cash and efficiency KPIs exist precisely to catch this problem before it becomes a crisis.

    Debtor days and creditor days should always be read together. The gap between them determines how much cash you need to fund your operating cycle. If you collect from customers in 45 days but pay suppliers in 30, you are funding a 15-day gap from your own cash reserves on every transaction. Multiply that across your entire revenue base and the working capital requirement becomes substantial. Closing this gap — by tightening collections, negotiating better supplier terms, or both — can free up significant cash without any impact on profitability. For more detail on managing this cycle, see our guide to working capital management.

    The current ratio and quick ratio are your early-warning liquidity indicators. Review them monthly alongside your cash flow forecast — a current ratio that was 1.8 in January and has declined to 1.2 by June is a trend worth acting on, even if the absolute number still looks acceptable in isolation. Our guide to key financial ratios covers the calculation and interpretation of these metrics in detail.

    Building a KPI Dashboard That Gets Used

    The biggest risk with a KPI framework is spending significant effort building a dashboard that nobody looks at after the first month. Here is how to design one that sticks:

    1. One page, always. Your monthly KPI report should fit on a single page or screen. If leadership cannot absorb it in two minutes, it will not be absorbed. Supplementary analysis lives in the appendix; the dashboard shows only the headline numbers.
    2. Show the trend, not just the current value. A gross margin of 42% is information. A gross margin that has moved from 47% to 42% over six months is a story. Always include a sparkline or three-month trend alongside the current figure.
    3. Use RAG status (Red, Amber, Green). Each KPI should have a defined target and threshold — green means on track, amber means approaching a concern, red means action needed. This lets the reader scan the dashboard in seconds rather than having to interpret every number from scratch.
    4. Define thresholds before the period, not after. If thresholds are set retrospectively to match actuals, the RAG status will always be green and the dashboard will provide false comfort. Set your amber and red thresholds at the start of each year, based on your budget and business requirements.
    5. Review on a fixed cadence. KPIs reviewed whenever someone remembers to look are not KPIs — they are historical records. Schedule a monthly finance review with a fixed agenda, and make the KPI dashboard the opening slide. Consistency is what makes the trend data meaningful over time.
    6. Link KPIs to your management accounts. Your KPI dashboard should be derivable directly from your management accounts pack — not maintained as a separate exercise. If the two are not in sync, you have a reconciliation problem that will erode trust in both. For how management accounts are structured, see our guide on management accounts vs statutory accounts.

    Key Takeaways

    • A good KPI answers a decision-relevant question, can be calculated consistently, moves over time, and has a named owner.
    • Track fewer KPIs more rigorously — five metrics reviewed and acted upon monthly beat twenty that appear in a report nobody reads.
    • Gross margin is the single most important profitability KPI for most businesses; declining gross margin cannot be fixed by cutting overheads.
    • Debtor days and creditor days should always be read together — the gap between them determines how much working capital your business needs to fund.
    • The current ratio and cash conversion cycle are your early-warning liquidity indicators; track them monthly alongside your cash flow forecast.
    • A one-page dashboard with RAG status, trend sparklines, and pre-defined thresholds is the format most likely to generate consistent management attention.
    • Your KPI dashboard should be derived directly from your management accounts — if they are not in sync, reconcile them before relying on either.

    Related reading: To build out your financial management toolkit alongside this KPI framework, explore our guides on key financial ratios explainedmanagement accounts vs statutory accountsworking capital management, and understanding the income statement.