
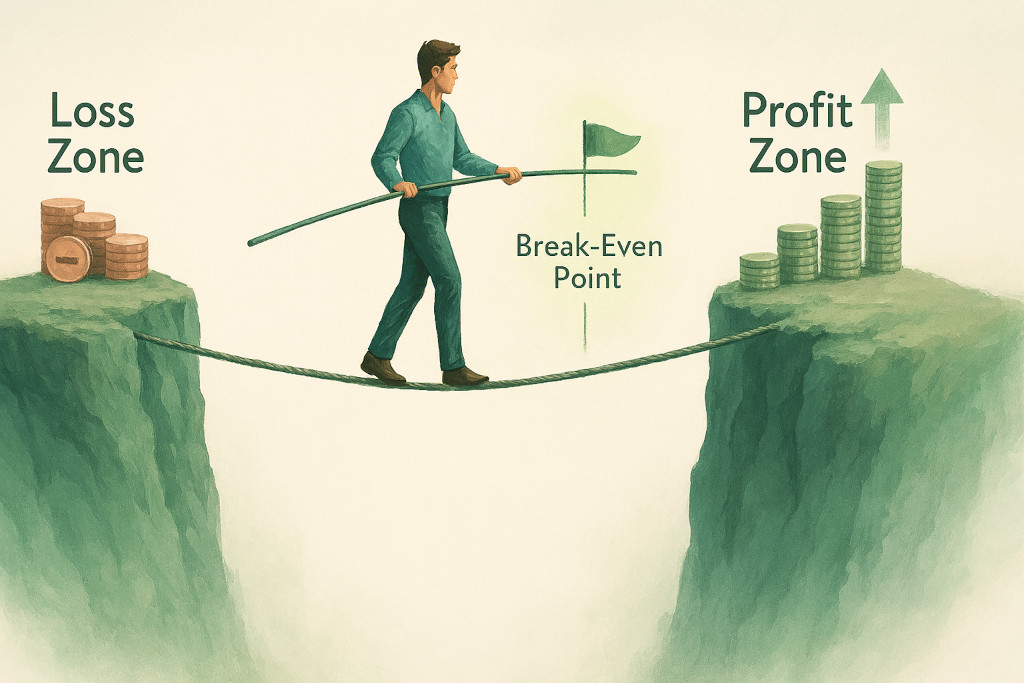
Before a business makes its first pound of profit, it must first earn enough to cover every cost it has already committed to — the rent, the salaries, the insurance, the equipment repayments. The exact point at which revenue catches up with those costs and profit begins is called the break-even point. Knowing where that line sits is one of the most powerful pieces of intelligence any business owner or manager can have. It answers the question every entrepreneur asks in quieter moments: how much do we actually need to sell just to keep the lights on?
What Is Break-Even Analysis?
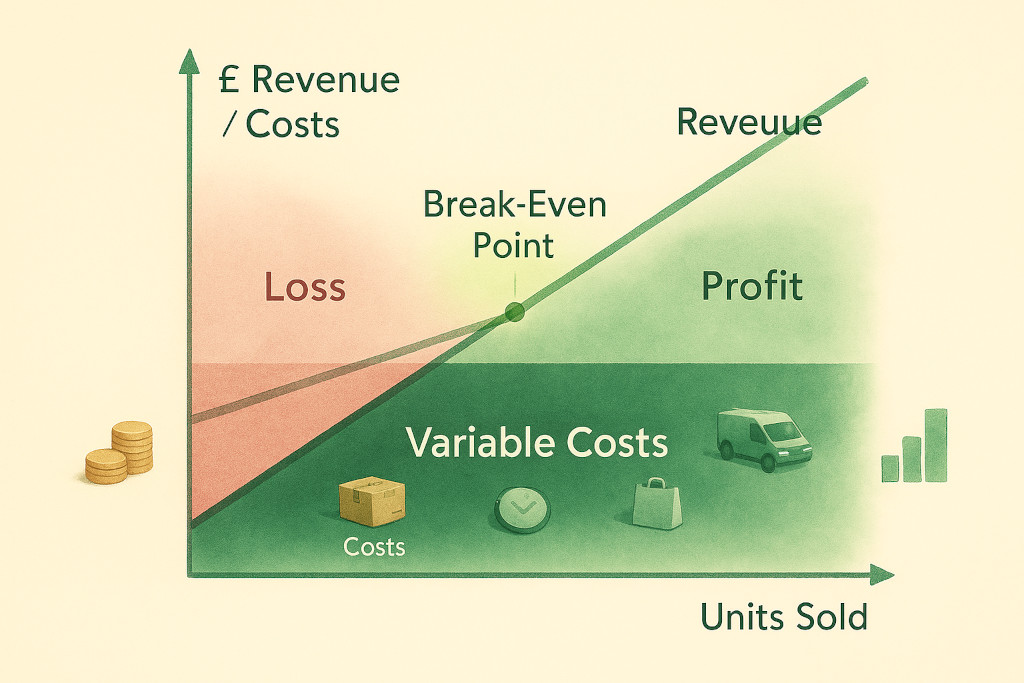
Break-even analysis is a management accounting technique that determines the level of sales at which total revenue equals total costs — producing neither a profit nor a loss. Below the break-even point, the business is making a loss; above it, the business is making a profit. The analysis is straightforward to perform, requires only basic cost information, and can inform a surprisingly wide range of business decisions from pricing to investment appraisal to hiring.
Unlike financial accounting, which records what has already happened, break-even analysis is a forward-looking tool. It is most useful when evaluating a new product, a new location, a change in pricing, or the impact of a cost increase. The question it always answers is: given our cost structure, how much output do we need to cover our costs?
The Three Ingredients: Fixed Costs, Variable Costs, and Contribution Margin
Break-even analysis rests on a clear separation of costs into two categories.
Fixed Costs
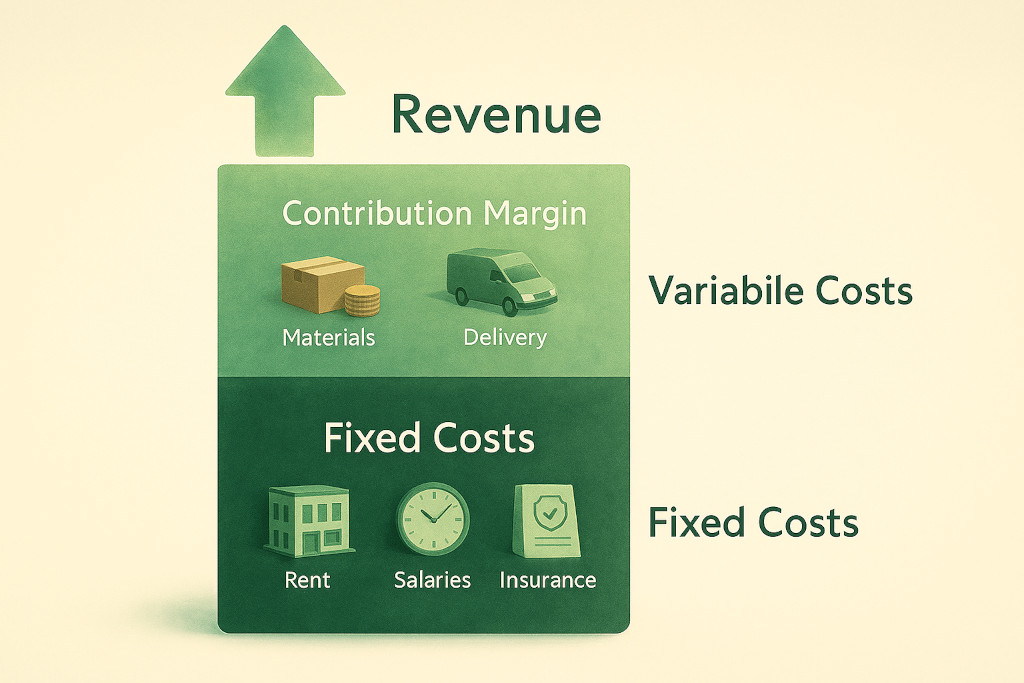
Fixed costs are costs that remain constant regardless of how much the business produces or sells. Rent, business rates, insurance premiums, salaried staff, loan repayments, and software subscriptions are all fixed costs. Whether you sell 100 units or 1,000 units this month, your rent does not change. These costs must be covered before any profit is earned.
Variable Costs
Variable costs change in direct proportion to output. The raw materials used to make a product, the packaging, the delivery cost, the sales commission — these all rise as production rises and fall when it falls. A useful test: if you produced zero units, would this cost be zero? If yes, it is variable.
Some costs fall between the two — semi-variable costs like utilities or a part-time worker whose hours flex with demand. For break-even purposes, these are typically split into their fixed and variable components, or approximated as one or the other based on materiality.
Contribution Margin
The contribution margin is the amount each unit sold contributes towards covering fixed costs — and ultimately towards profit — after its own variable cost has been deducted.
Contribution Margin per Unit = Selling Price per Unit − Variable Cost per Unit
This is the engine of break-even analysis. The higher the contribution margin, the fewer units you need to sell to cover your fixed costs. A business with a high contribution margin reaches break-even faster than one that makes only a small margin on each unit.
Calculating the Break-Even Point
Once you have your fixed costs and contribution margin, the break-even point in units follows directly:
Break-Even Point (Units) = Total Fixed Costs ÷ Contribution Margin per Unit
To express break-even as a revenue figure rather than a unit count:
Break-Even Revenue = Break-Even Units × Selling Price per Unit
Alternatively, you can use the contribution margin ratio — the contribution margin expressed as a percentage of selling price — to go straight to a revenue figure:
Break-Even Revenue = Total Fixed Costs ÷ Contribution Margin Ratio
Worked Example: Harlow Candles Ltd
Harlow Candles Ltd makes and sells scented candles. Here is their cost structure for a month:
| Cost Item | Type | Amount (£) |
|---|---|---|
| Studio rent | Fixed | 1,200 |
| Equipment lease | Fixed | 400 |
| Owner salary | Fixed | 2,000 |
| Insurance & subscriptions | Fixed | 150 |
| Total Monthly Fixed Costs | 3,750 | |
| Wax, wick, fragrance, jar (per candle) | Variable | 3.50 |
| Packaging & labelling (per candle) | Variable | 0.75 |
| Postage/fulfilment (per candle) | Variable | 1.25 |
| Total Variable Cost per Candle | 5.50 | |
| Selling Price per Candle | 14.00 |
Step 1 — Contribution Margin per unit:
£14.00 − £5.50 = £8.50 per candle
Step 2 — Break-Even Point in units:
£3,750 ÷ £8.50 = 442 candles per month
Step 3 — Break-Even Revenue:
442 × £14.00 = £6,188 per month
So Harlow Candles must sell 442 candles — generating £6,188 in revenue — just to cover all costs and break even. Every candle sold beyond that number contributes £8.50 directly to profit.
The break-even point is not a target — it is a floor. It tells you the minimum you must achieve before profit begins. The real goal is to understand how far above that floor your business is operating, and what it would take to push it lower.
The Margin of Safety
Once you know your break-even point, you can calculate the margin of safety — the gap between your actual or expected sales and the break-even level. This tells you how much sales could fall before the business tips into a loss.
Margin of Safety (Units) = Actual Sales − Break-Even Sales
Margin of Safety (%) = (Margin of Safety Units ÷ Actual Sales) × 100
If Harlow Candles currently sells 600 candles per month, its margin of safety is 158 candles (600 − 442), or about 26%. This means sales could drop by a quarter before the business loses money — a reasonable buffer, though tighter than many business owners realise.
A low margin of safety is an early warning. It means the business is operating close to the break-even line and has limited resilience to unexpected drops in demand, a price cut from a competitor, or an increase in variable costs.
Using Break-Even Analysis for Business Decisions
The break-even calculation is most valuable not as a one-time exercise but as a decision-support tool applied repeatedly to different scenarios.
- Pricing decisions. What happens to break-even if we reduce the price by £1.50 to stay competitive? At £12.50 per candle, the contribution margin drops to £7.00 and the break-even point rises to 536 units — 94 more candles per month just to stand still.
- Cost increases. If raw material costs rise by 20p per candle, contribution margin falls to £8.30 and break-even rises to 452 units. Is that increase enough to justify a price rise?
- New product or service. Before launching a new line, calculate its break-even point. Does it reach break-even at a realistic sales volume, or does it require more volume than the market is likely to deliver?
- Hiring decisions. Adding a part-time employee increases fixed costs by £800/month. How many additional units must be sold to cover that new cost? (£800 ÷ £8.50 = 95 additional candles per month.)
- Investment appraisal. A new piece of equipment costs £6,000 and reduces variable cost per unit by £0.60. How many units must be sold before the investment pays back through the improved margin?
In each case, break-even analysis provides a concrete, quantified answer to what would otherwise be a vague judgement call. It does not make the decision — but it ensures the decision is made with clear numbers in hand.
Limitations to Keep in Mind
Break-even analysis is a powerful tool, but it rests on simplifying assumptions that are worth acknowledging.
- Costs are rarely perfectly fixed or variable. In reality, many costs are semi-variable — step costs that jump at certain volume thresholds (a second van, a larger warehouse) create discontinuities that a simple break-even model does not capture.
- Selling price is assumed constant. Volume discounts, variable pricing, or promotional campaigns mean revenue does not always grow in a perfectly straight line with units sold.
- It works best for single-product businesses. When a business sells multiple products with different margins, a weighted average contribution margin is needed, which adds complexity and can obscure individual product economics.
- It is a static snapshot. Break-even analysis reflects costs and prices at a point in time. As costs and prices change, the model needs to be updated to remain useful.
These limitations do not diminish its usefulness — they simply mean it should be treated as one analytical tool among several, not a complete picture of business performance. Pair it with your cash flow forecast and your income statement for a fuller view of where your business stands.
Key Takeaways
- The break-even point is where total revenue equals total costs — the minimum sales level needed before profit begins.
- Fixed costs stay constant regardless of output; variable costs rise and fall with production. Classifying your costs correctly is the foundation of accurate break-even analysis.
- Contribution Margin per Unit = Selling Price − Variable Cost per Unit. This figure drives everything: the higher the contribution margin, the lower the break-even point.
- Break-Even Units = Total Fixed Costs ÷ Contribution Margin per Unit.
- The margin of safety tells you how far sales can fall before the business makes a loss. A low margin of safety demands attention.
- Use break-even analysis iteratively — for pricing changes, cost increases, new products, and hiring decisions — rather than as a one-off calculation.
Related reading: Break-even analysis sits within the broader discipline of management reporting. For the financial statements that give context to your cost structure, see our guides to the Income Statement and the Cash Flow Statement. To understand how break-even fits into the broader picture of business performance measurement, our post on Key Financial Ratios covers the profitability and efficiency metrics that complement break-even thinking. For projecting future cash needs alongside your break-even calculations, see our Cash Flow Forecasting guide.