Category: Accounting Basics

  • Corporation Tax Explained: A Plain-English Guide for UK Limited Companies

    Corporation Tax Explained: A Plain-English Guide for UK Limited Companies

    Corporation tax is one of those subjects that many limited company directors leave entirely to their accountant — and while getting professional advice is always sensible, having no idea how the tax is calculated or when it falls due is a risk. Unexpected tax bills damage cash flow. Missed deadlines trigger automatic penalties. And not understanding the difference between your accounting profit and your taxable profit means you can’t have an informed conversation about your tax position. This guide covers the essentials: what corporation tax is, how taxable profit is calculated, what rates apply, and how the liability appears in your financial statements.

    What Is Corporation Tax and Who Pays It?

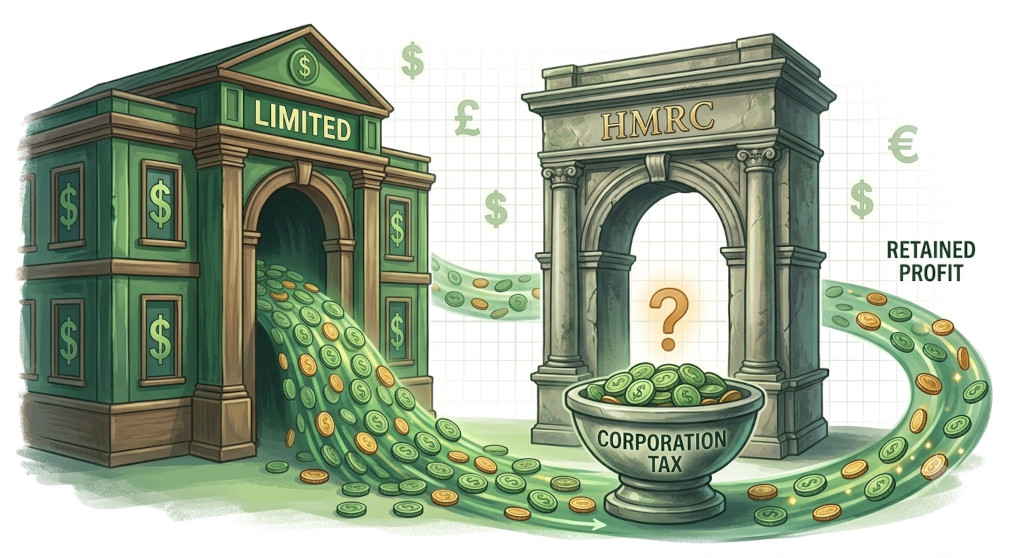
    Corporation tax is a tax on the profits of UK limited companies. Unlike income tax — which is levied on individuals — corporation tax is charged on the profits earned by the company as a legal entity in its own right. It applies to UK-resident companies on their worldwide profits, and to non-UK-resident companies on profits arising from UK activities.

    Sole traders and partnerships do not pay corporation tax. Their profits are taxed through self-assessment income tax instead. Corporation tax is specifically a limited company obligation — one of the key financial differences between operating as a sole trader and incorporating. Our post on sole trader vs limited company accounting covers these structural differences in more detail.

    Every UK limited company must register with HMRC for corporation tax within three months of starting to trade. The company then files a corporation tax return (form CT600) and pays any tax due each year, regardless of whether it actually distributes profits to its shareholders.

    Accounting Profit vs Taxable Profit
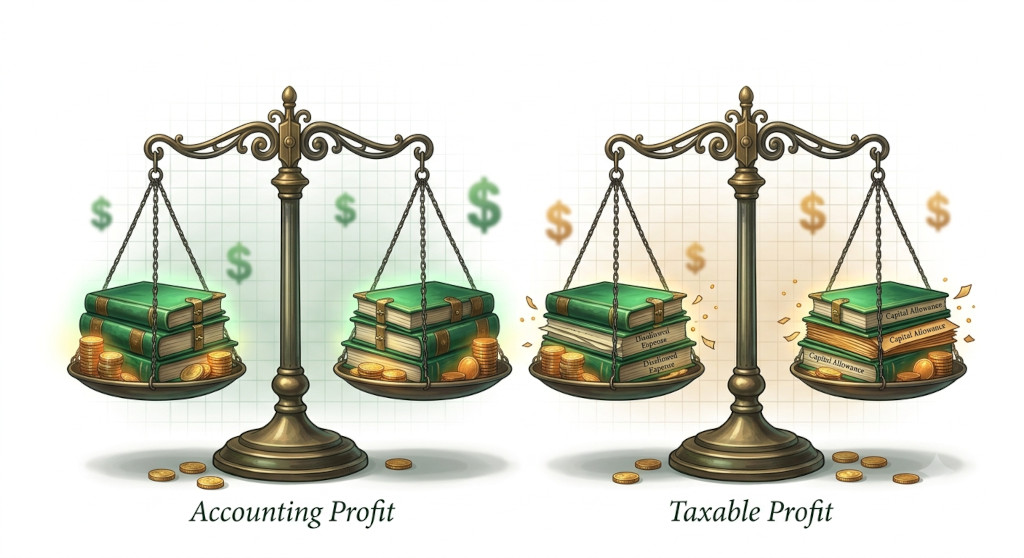
    The most important concept to grasp is that the profit figure in your accounts and the profit figure on which you pay tax are not the same thing. Your accountant starts with accounting profit — the net profit shown in your income statement — and then makes a series of adjustments to arrive at taxable profit.

    Disallowed expenses are costs that have been deducted in arriving at accounting profit but which HMRC does not permit as tax deductions. Common examples include client entertainment (meals, events, hospitality), fines and penalties, and the depreciation charge itself.

    Capital allowances are HMRC’s own system for giving tax relief on capital expenditure — they replace the depreciation charge that is disallowed. Rather than deducting accounting depreciation, the company claims capital allowances instead. The Annual Investment Allowance (AIA) currently allows most businesses to deduct 100% of qualifying capital expenditure in the year of purchase, up to the AIA limit. Writing Down Allowances (WDAs) apply to expenditure above the AIA limit. Our guide on capital vs revenue expenditure explains the distinction between capital items and revenue costs in detail.

    The golden rule: accounting depreciation is always added back when calculating taxable profit, and capital allowances are claimed in its place. These two figures will rarely be the same, which is why your tax charge almost never equals your accounting profit multiplied by the tax rate.

    Other adjustments may include timing differences on accruals, losses carried forward from earlier years, and any income that is taxable but not yet recognised in the accounts (or vice versa).

    Corporation Tax Rates (UK)

    From 1 April 2023, the UK moved to a two-rate corporation tax system based on the level of profits. The previous flat rate of 19% was replaced with a tapered structure.

    Profit LevelRateNotes
    Up to £50,00019% (Small Profits Rate)Full small profits rate applies
    £50,001 – £250,00019%–25% (Marginal Relief)Effective rate tapered between the two rates
    Over £250,00025% (Main Rate)Full main rate applies

    The profit thresholds are divided by the number of associated companies — so a group of three companies would each have thresholds of £50,000 ÷ 3 and £250,000 ÷ 3, meaning the main rate kicks in earlier for each entity. Associated company rules are a common area of complexity for group structures.

    Marginal Relief provides a smooth transition between the small profits rate and the main rate. Rather than jumping sharply from 19% to 25% at the £50,000 threshold, the effective rate rises gradually as profits increase through the marginal band. Your accounting software or accountant will calculate the exact relief applicable.

    Worked Example — Stoneleigh Digital Ltd

    Stoneleigh Digital Ltd is a UK software development company. For the year ended 31 March, the company’s accounts show the following.

    Item£Notes
    Net profit per accounts85,000Per income statement
    Add back: depreciation12,000Disallowed — replaced by capital allowances
    Add back: client entertainment3,200Disallowed expense
    Less: Annual Investment Allowance(18,000)Capital allowance on equipment purchased
    Less: prior year loss relief(5,000)Losses carried forward from prior period
    Taxable Profit77,200
    Corporation Tax @ 25% (main rate)19,300Profits above £250k threshold — n/a here
    Marginal Relief(1,540)Relief calculated on profits in marginal band
    Corporation Tax Liability17,760Effective rate approx 23%

    Stoneleigh’s accounting profit of £85,000 becomes a taxable profit of £77,200 after the required adjustments. The tax liability of £17,760 represents an effective rate of approximately 23% on taxable profit — higher than the small profits rate of 19% but below the main rate of 25%, because the profits fall in the marginal relief band.

    Key Deadlines: When to File and Pay
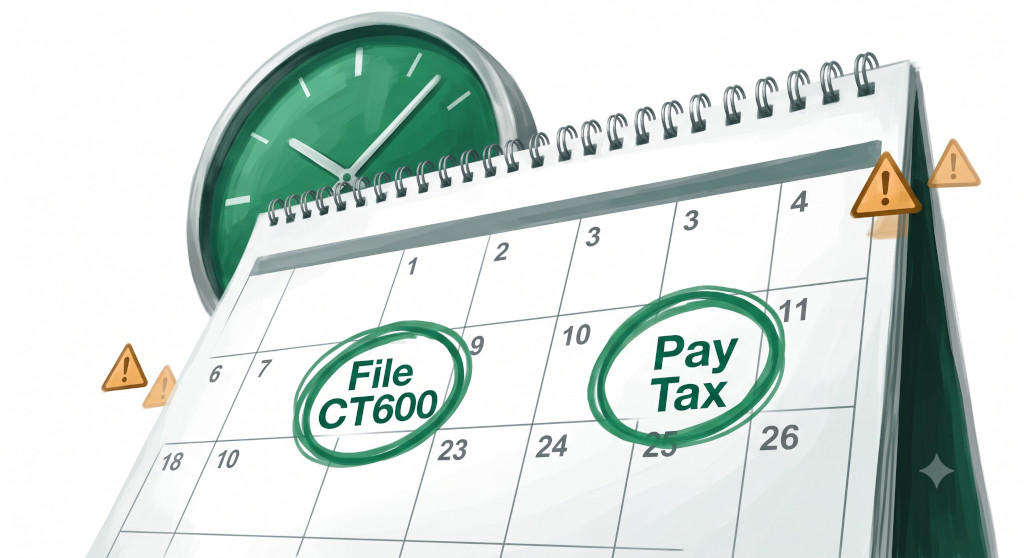
    Two separate deadlines govern corporation tax — one for filing and one for payment — and they are not the same date.

    Payment deadline: For most small companies, corporation tax must be paid to HMRC within nine months and one day after the end of the accounting period. For a company with a 31 March year end, tax for that period is due by 1 January of the following year. Large companies (broadly those with profits above £1.5 million) pay in quarterly instalments during and after the accounting period.

    Filing deadline: The CT600 corporation tax return must be filed with HMRC within twelve months of the end of the accounting period — three months after the payment deadline. HMRC imposes automatic late filing penalties starting at £100, rising to £200 after three months, with additional tax-geared penalties for returns more than six months late.

    Missing the payment deadline triggers interest charges on the unpaid amount from the due date. These are not discretionary — HMRC calculates and charges them automatically. Provisioning for the tax liability well in advance and keeping it separate in a dedicated savings account is standard good practice for any limited company.

    How Corporation Tax Appears in Your Accounts

    The corporation tax charge is shown on the income statement as a separate line below operating profit and interest, reducing net profit to the post-tax figure.

    Before the tax is actually paid, the liability sits on the balance sheet as a current liability — “Corporation Tax Payable” or “Tax Creditor.” It is created by the journal entry that recognises the charge (debit: Tax Expense; credit: Tax Payable) and cleared when the payment reaches HMRC (debit: Tax Payable; credit: Bank).

    In the cash flow statement (indirect method), the tax payment appears as a cash outflow within operating activities — typically as a separate line “Corporation tax paid,” because the timing of payment rarely matches the period the charge was recognised in. A company might recognise the tax charge for the year ended 31 March in those accounts, but not pay it until the following January.

    Key Takeaways

    • Corporation tax is paid by UK limited companies on their taxable profits. Sole traders are not subject to it — they pay income tax through self-assessment instead.
    • Taxable profit is not the same as accounting profit. Depreciation is disallowed and replaced by capital allowances; client entertainment and penalties are disallowed outright; prior year losses can be offset.
    • UK corporation tax rates (from April 2023): 19% on profits up to £50,000, 25% on profits over £250,000, with marginal relief tapering the rate in between. Thresholds are divided among associated companies.
    • Tax must be paid within nine months and one day of the period end. The CT600 return must be filed within twelve months. These are separate deadlines — missing either triggers penalties or interest.
    • The corporation tax liability sits on the balance sheet as a current liability until paid, and the tax charge appears below operating profit on the income statement.

    Related reading: If you found this guide useful, you may also want to read our posts on gross, operating, and net profit marginscapital vs revenue expenditureunderstanding the income statement, and understanding the balance sheet.
  • Payroll Accounting Basics: How to Record Wages, PAYE, and NIC in Your Books

    Payroll Accounting Basics: How to Record Wages, PAYE, and NIC in Your Books

    Hiring your first employee is a milestone — but it also marks the moment your accounting gets significantly more complicated. Suddenly you’re not just recording invoices and payments. You’re managing gross pay, income tax deductions, National Insurance contributions from both sides, pension obligations, and a monthly payment to HMRC that has to be right. Many small business owners leave payroll entirely to their software or accountant and never look at what’s actually being recorded in the books. That’s a mistake. Understanding how payroll flows through your accounts gives you a clearer picture of your true employment costs, helps you spot errors, and makes you a more informed reader of your own financial statements.

    The Anatomy of a Payslip

    Before you can record payroll in your accounts, you need to understand what a payslip actually contains — because each element is treated differently in the bookkeeping.

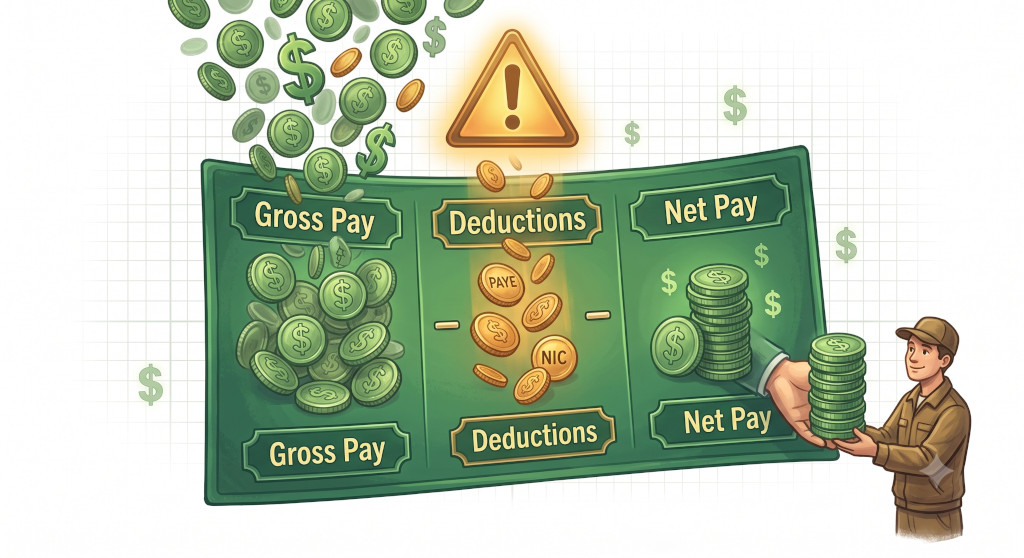
    Gross pay is what the employee earns before any deductions. This is the figure agreed in their employment contract — whether monthly salary, hourly rate, or a combination of basic pay and additional elements like overtime or bonuses.

    Employee deductions are amounts withheld from the employee’s gross pay before the net amount is paid to them. The two main deductions for most employees are income tax (collected under the Pay As You Earn system — PAYE) and the employee’s National Insurance Contribution (employee NIC). For employees enrolled in a workplace pension, their pension contribution is also deducted here.

    Net pay is what the employee actually receives in their bank account — gross pay minus all employee deductions.

    But from an accounting perspective, the payslip only tells half the story. The employer also has obligations that appear nowhere on the employee’s payslip.

    The True Cost of an Employee

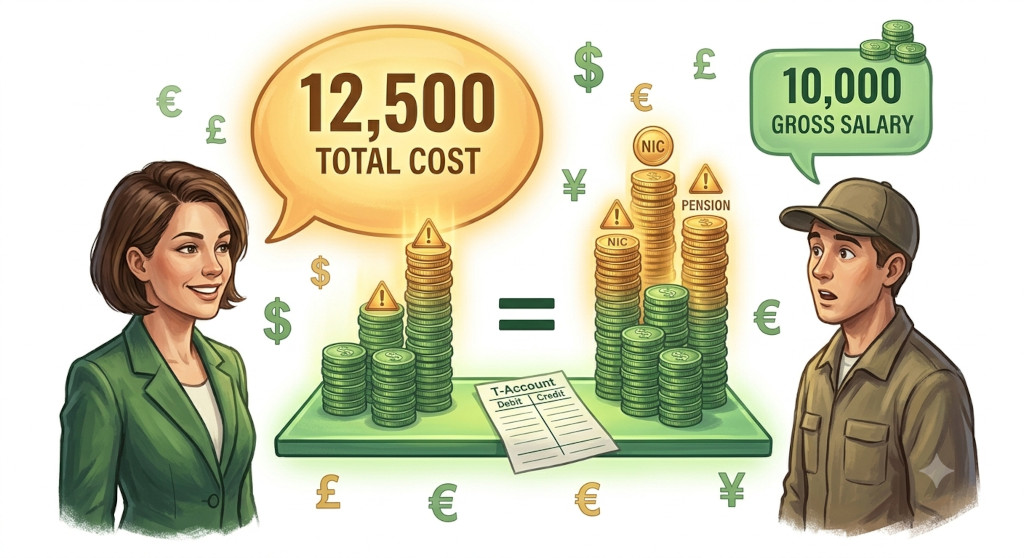
    What the employee earns and what the employment actually costs the business are two different figures. The difference is the employer’s on-costs — specifically employer’s National Insurance Contributions and employer pension contributions.

    Employer NIC is a separate charge on the employer, calculated as a percentage of the employee’s earnings above the secondary threshold. Unlike employee NIC (which reduces the employee’s take-home pay), employer NIC is an additional cost on top of gross pay — it does not appear on the payslip at all, but it absolutely appears in the business’s accounts as an expense.

    Employer pension contributions are the minimum amounts the employer is required to contribute under auto-enrolment — currently a minimum of 3% of qualifying earnings — on top of the employee’s own contributions.

    A common shock for first-time employers: an employee on a £35,000 salary doesn’t cost £35,000 a year. Once employer NIC and pension are added, the actual employment cost is closer to £38,500–£40,000 depending on the pension contribution rate. This distinction matters enormously for budgeting and for understanding your true staffing costs.

    Worked Example — Maplewood Studio Ltd

    Maplewood Studio Ltd employs a graphic designer on a gross monthly salary of £3,000. The table below breaks down the full payroll picture for a single month, including the deductions from the employee’s pay and the additional employer costs.

    ItemAmount (£)Who Bears the Cost
    EMPLOYEE’S PAYSLIP
    Gross Pay3,000.00Employee earns
    Less: Income Tax (PAYE)(420.00)Deducted from employee
    Less: Employee NIC (Class 1)(195.00)Deducted from employee
    Less: Employee Pension (5%)(150.00)Deducted from employee
    Net Pay to Employee2,235.00Paid to employee’s bank
    EMPLOYER’S ADDITIONAL COSTS
    Employer NIC (Class 1)285.00Additional employer cost
    Employer Pension (3%)90.00Additional employer cost
    Total Employment Cost3,375.00Total business cost per month

    The employee takes home £2,235. The business pays out £3,375 in total — £2,235 to the employee, £615 to HMRC (PAYE £420 + employee NIC £195 + employer NIC £285), and £240 to the pension scheme (employee contribution £150 + employer contribution £90). The gross salary of £3,000 is just the starting point, not the total cost.

    Note: The figures above are illustrative. Actual PAYE and NIC amounts depend on the employee’s tax code, their earnings above the Primary Threshold (for employee NIC) and Secondary Threshold (for employer NIC), and other factors including age and employment allowances.

    The Payroll Journal Entries

    Payroll is recorded through two separate journal entries. The first recognises the expense and creates the liabilities. The second clears those liabilities when the cash payments go out.

    Journal Entry 1 — Recording the Payroll

    Posted on the pay date (or period end), this entry records the full cost of employment and creates liabilities owed to the employee, HMRC, and the pension provider.

    AccountDebit (£)Credit (£)Explanation
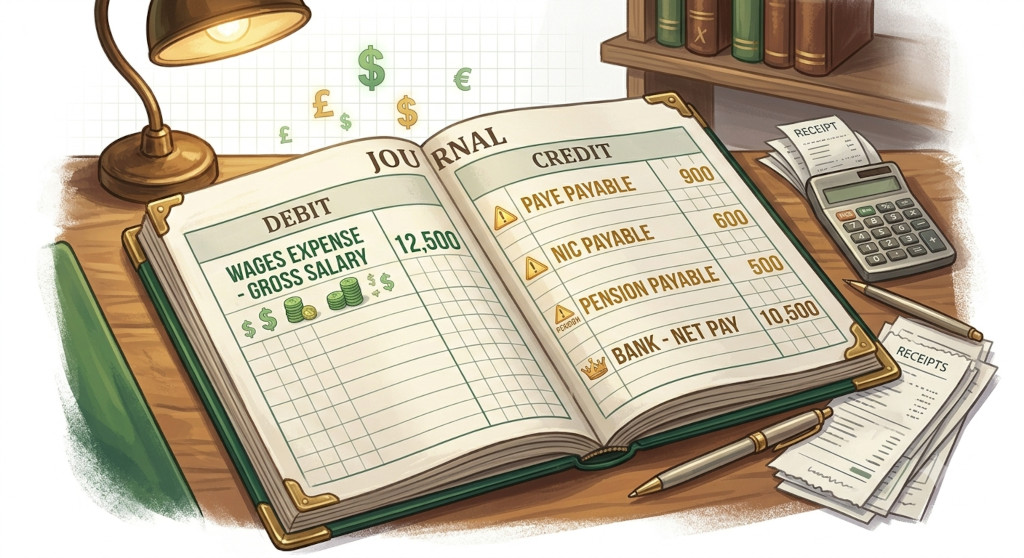
    Wages Expense3,000.00Gross salary cost
    Employer NIC Expense285.00Employer NIC on-cost
    Employer Pension Expense90.00Employer pension contribution
    Net Wages Payable2,235.00Amount owed to employee
    PAYE / NIC Payable900.00PAYE £420 + emp NIC £195 + er NIC £285
    Pension Payable240.00Employee £150 + employer £90
    Total3,375.003,375.00Balanced ✓

    Journal Entry 2 — Making the Payments

    When payments leave the bank — net pay to the employee, PAYE/NIC to HMRC, and pension to the scheme — the liabilities are cleared.

    AccountDebit (£)Credit (£)Explanation
    Net Wages Payable2,235.00Clearing employee liability
    PAYE / NIC Payable900.00Clearing HMRC liability
    Pension Payable240.00Clearing pension liability
    Bank / Current Account3,375.00Total cash out of bank
    Total3,375.003,375.00Balanced ✓

    The two-entry approach exists because of timing. The employee is paid at month end, but the PAYE/NIC payment to HMRC is due by the 19th of the following month (22nd for electronic payment). Splitting the entries correctly creates the liability when the obligation arises, and clears it only when cash actually leaves the bank.

    How Payroll Appears in Your Financial Statements

    After these entries are posted, payroll costs flow through the financial statements as follows.

    On the income statement, the full employment cost — gross wages £3,000, employer NIC £285, employer pension £90 — appears as an operating expense, reducing operating profit by £3,375 for the period. The net pay figure of £2,235 tells you nothing meaningful about the business cost; it is the total employment cost that matters for profit analysis.

    On the balance sheet, any outstanding payroll liabilities (PAYE/NIC not yet paid to HMRC, net pay not yet transferred) sit as current liabilities until the payments clear. After all payments are made, no residual payroll liability remains for that month.

    On the cash flow statement, the payments to the employee, HMRC, and the pension scheme appear as operating cash outflows in the period they are made — which may straddle month-end if PAYE is paid in the following month. Our guide to accruals and prepayments covers how timing differences between expense recognition and cash payment are handled more broadly.

    Key Takeaways

    • An employee’s net pay is not the total cost of employment. Add employer NIC and employer pension on top of gross salary to find the true employment cost — the figure that hits your income statement.
    • Payroll is recorded in two journal entries: one to recognise the expense and create liabilities (on pay date), and one to clear those liabilities when the cash payments leave the bank.
    • Employee deductions (PAYE, employee NIC, employee pension) are withheld from the employee’s gross pay and held as liabilities until remitted to HMRC and the pension scheme — they are the employer’s responsibility to collect and pay over, but not the employer’s expense.
    • PAYE and NIC must reach HMRC by the 19th of the month following the payroll date (22nd electronically). Late payment attracts interest and penalties.
    • Understanding the full employment cost — not just the salary line — is essential for accurate budgeting, pricing, and financial analysis.

    Related reading: If you found this guide useful, you may also want to read our posts on double-entry bookkeeping explainedaccruals and prepayments explainedchart of accounts for SMEs, and understanding the income statement.

  • Gross, Operating, and Net Profit Margin: What They Mean and Why They Matter

    Gross, Operating, and Net Profit Margin: What They Mean and Why They Matter

    Two businesses each report £500,000 in annual revenue. One is thriving; the other is quietly struggling. The difference doesn’t show up in the top line — it shows up in the margins. Profit margins are among the most powerful diagnostic tools in accounting, revealing not just whether a business is making money but where that money is being made (or lost) and how efficiently it is being converted from revenue into actual profit. Understanding the difference between gross, operating, and net profit margin is essential for any business owner who wants to genuinely understand their financial performance.

    What Is a Profit Margin?

    A profit margin expresses profit as a percentage of revenue. Rather than looking at profit in absolute terms — “we made £50,000 this year” — a margin lets you assess profitability relative to the size of the business and compare performance across different periods, businesses, and industries.

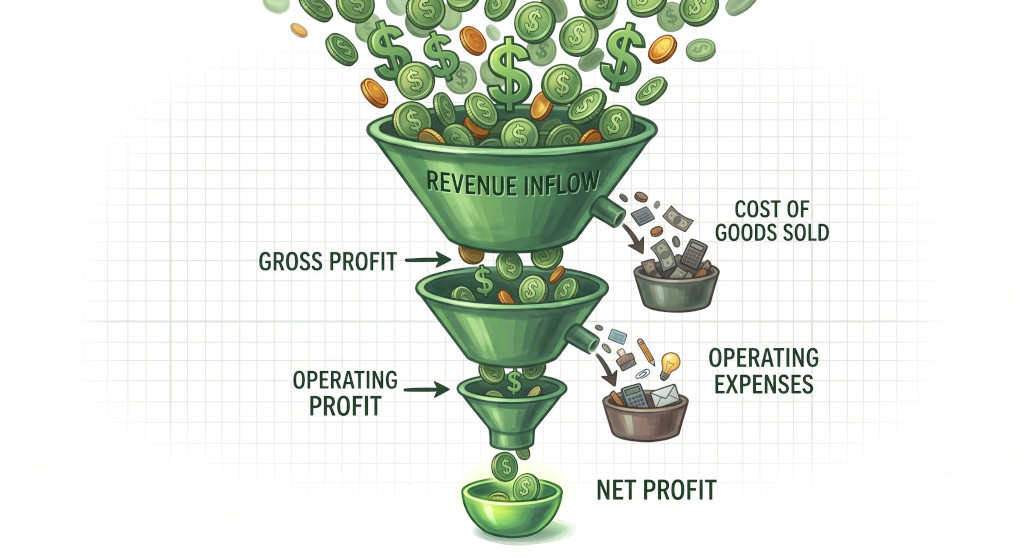
    There are three profit margins that matter most, each calculated from a different line on the income statement:

    • Gross profit margin — measures how efficiently you produce or source what you sell
    • Operating profit margin — measures how well you manage the full cost of running the business
    • Net profit margin — measures the ultimate bottom-line return after all costs, interest, and tax

    Each one peels back a different layer of cost, and together they tell a much richer story than any single profit figure on its own.

    Revenue tells you the size of your business. Profit tells you whether it makes money. Margin tells you how efficiently it converts one into the other — and that’s the number that really matters when comparing performance over time or against competitors.

    Gross Profit Margin

    Gross profit is revenue minus the cost of goods sold (COGS) — the direct costs of producing or purchasing what you sell. For a manufacturer, COGS includes raw materials, direct labour, and production overheads. For a retailer, it’s the wholesale cost of the stock sold. For a service business, it typically includes the direct labour and materials consumed in delivering the service.

    Gross profit margin = (Gross profit ÷ Revenue) × 100

    If your business generates £500,000 in revenue and your COGS is £300,000, your gross profit is £200,000 and your gross margin is 40%.

    The gross margin tells you how much of every pound of revenue is left after covering the direct cost of what you sold. That remaining amount is what you have available to cover all your other overheads, pay your interest and tax, and deliver a return to owners. A falling gross margin is usually a signal that either your input costs are rising, your pricing is slipping, or your product mix is shifting toward lower-margin lines.

    Gross margins vary enormously by industry. A supermarket might operate on gross margins of 25–30%. A software company might achieve 70–80%. A professional services firm might be above 50%. What matters most is not the absolute number but the trend over time and how it compares to others in the same sector.

    Operating Profit Margin

    Operating profit — sometimes called EBIT (earnings before interest and tax) — deducts all operating expenses from gross profit. This includes everything it costs to run the business day-to-day that isn’t directly tied to production: rent, salaries, utilities, insurance, depreciation, marketing, and administrative costs.

    Operating profit margin = (Operating profit ÷ Revenue) × 100

    Continuing the example: if gross profit is £200,000 and total operating expenses are £120,000, operating profit is £80,000 and the operating margin is 16%.

    The operating margin is arguably the most important of the three for assessing the underlying health of a business, because it strips out the effects of how the business is financed (interest) and the tax environment it operates in. It reflects the core commercial efficiency — how well management is converting revenue into profit through the combination of pricing, cost control, and operational leverage.

    A business with a high gross margin but a low operating margin has a cost structure problem — overheads are consuming the gross profit before it can become earnings. A business with a stable operating margin year-on-year is demonstrating good cost discipline even as revenue fluctuates.

    Net Profit Margin

    Net profit is what remains after deducting interest on debt and corporation tax from operating profit. It is the bottom line — the final measure of what the business actually earned for its owners in the period.

    Net profit margin = (Net profit ÷ Revenue) × 100

    If operating profit is £80,000, interest charges are £8,000, and the corporation tax liability is £18,000, net profit is £54,000 and the net margin is 10.8%.

    The net margin is the most comprehensive measure of profitability, but it is also the most susceptible to factors that aren’t directly related to operational performance — the level of debt (which determines interest charges), the tax jurisdiction, and one-off items such as asset disposals or restructuring costs. Two businesses with identical operations could have very different net margins purely because one carries significant debt and the other is equity-funded.

    For this reason, analysts and investors often focus on operating margin for comparing like-for-like performance and use net margin as the final check on overall financial health after accounting for capital structure and tax.

    Worked Example — Halston Kitchens Ltd

    Halston Kitchens Ltd designs and installs bespoke fitted kitchens for residential and commercial clients. Here is a summary of the company’s income statement for the year ended 31 December, alongside the calculated margins.

    Income Statement Item£Margin
    Revenue620,000100%
    Cost of goods sold (materials + direct labour)(248,000)
    Gross Profit372,00060.0%
    Salaries and wages (non-direct)(115,000)
    Rent and utilities(42,000)
    Depreciation(18,000)
    Marketing and other overheads(31,000)
    Operating Profit (EBIT)166,00026.8%
    Interest on bank loan(12,000)
    Corporation tax(38,500)
    Net Profit115,50018.6%

    Reading across the three margins tells a clear story. Halston’s 60% gross margin is strong — materials and direct labour account for only 40% of revenue, suggesting good pricing power and controlled input costs. The operating margin of 26.8% shows that overheads are well managed relative to the scale of the business. The gap between gross and operating margin (33.2 percentage points) represents the overhead burden — reasonable for a business of this type. The net margin of 18.6% is healthy after interest and tax, indicating that the debt load is manageable and the business is genuinely profitable at the bottom line.

    Using Margins to Diagnose Business Performance

    The real power of profit margins comes from tracking them over time and asking the right questions when they move.

    Gross margin falling? Check whether input costs have risen (supplier price increases, higher wages for direct staff), whether selling prices have been discounted, or whether the product mix has shifted toward lower-margin lines. This is often the first warning sign of a pricing or procurement problem.

    Operating margin shrinking despite a stable gross margin? Overheads are growing faster than revenue. Common causes include staff headcount that has outpaced sales growth, rising rent or energy costs, or marketing spend that isn’t converting to revenue. This points to a scalability or cost-control issue rather than a pricing problem.

    Net margin low despite a healthy operating margin? The business may be carrying too much debt (high interest charges) or facing an above-average tax burden. This is a capital structure question rather than an operational one.

    Margins are most useful when compared against your own prior periods (to spot trends), your budget (to spot variances), and industry benchmarks (to assess competitive position). Our post on financial ratios explained covers a broader set of profitability and efficiency metrics that complement margin analysis.

    Key Takeaways

    • Gross profit margin = (Gross profit ÷ Revenue) × 100. It measures how efficiently you produce or source what you sell, after direct costs only.
    • Operating profit margin = (Operating profit ÷ Revenue) × 100. It measures core business efficiency after all operating costs, excluding interest and tax.
    • Net profit margin = (Net profit ÷ Revenue) × 100. It is the final bottom-line return after all costs, interest, and tax — the most comprehensive but most susceptible to non-operational factors.
    • A falling gross margin usually signals a pricing or cost-of-goods problem. A falling operating margin with a stable gross margin usually signals an overhead problem. A low net margin with a healthy operating margin usually signals a debt or tax issue.
    • Margins are most valuable when tracked over time and compared against budget and industry benchmarks — not just read as a one-off snapshot.

    Related reading: If you found this guide useful, you may also want to read our posts on understanding the income statementfinancial ratios explainedbreak-even analysis explained, and understanding the balance sheet.
  • Depreciation Methods Explained: Straight-Line vs Reducing Balance

    Depreciation Methods Explained: Straight-Line vs Reducing Balance

    When a business buys a piece of equipment, a vehicle, or any other long-term asset, that cost doesn’t hit the income statement all at once. It would distort the financials completely — one terrible month followed by years of apparent profitability with no corresponding cost. Instead, accounting spreads the cost of the asset across its useful life through a process called depreciation. But how that cost is spread matters enormously, and the method you choose affects your profit figures, your tax position, and the carrying value of your assets on the balance sheet every single year.

    What Is Depreciation?

    Depreciation is the systematic allocation of the cost of a tangible fixed asset over its expected useful life. It recognises that assets wear out, become obsolete, or lose value over time — and it matches that loss of value to the accounting periods in which the asset is being used to generate income. This is the matching principle at work.

    When you buy a delivery van for £24,000, you don’t expense £24,000 in year one. Instead, you capitalise it on the balance sheet as a non-current asset and then depreciate it gradually, charging a portion of the cost to the income statement each year as a depreciation expense.

    Depreciation is not a cash flow — it’s a non-cash accounting entry. The money left the business when the asset was purchased. Depreciation simply recognises, period by period, that the asset is being consumed in the process of generating revenue.

    Two values matter in depreciation calculations: the cost of the asset (what you paid for it) and the residual value (the estimated amount you’ll receive when you dispose of it at the end of its useful life). The difference between these two figures — the depreciable amount — is what you spread over the asset’s useful life.

    The Straight-Line Method

    The straight-line method is the simplest and most widely used approach. It allocates an equal amount of depreciation in every accounting period across the asset’s useful life. The annual charge never changes — it is the same in year one as it is in the final year.

    The formula is straightforward:

    Annual depreciation = (Cost − Residual value) ÷ Useful life in years

    Using the delivery van example — cost £24,000, residual value £4,000, useful life 4 years:

    Annual depreciation = (£24,000 − £4,000) ÷ 4 = £5,000 per year

    Each year, £5,000 is charged to the income statement as a depreciation expense, and the net book value (NBV) of the van on the balance sheet falls by £5,000. After four years, the van sits on the balance sheet at its residual value of £4,000 and is fully depreciated.

    The straight-line method is favoured for assets that provide roughly equal benefit throughout their lives — office furniture, fixtures and fittings, leasehold improvements, and most plant and machinery fall into this category.

    The Reducing Balance Method

    The reducing balance method — also called the declining balance method — applies a fixed percentage rate to the asset’s net book value at the start of each period, rather than to its original cost. Because the NBV falls each year, the depreciation charge also falls each year, producing a front-loaded pattern of expense that is heavier in the early years and lighter later on.

    The formula is:

    Annual depreciation = Net book value at start of period × Depreciation rate %

    Using the same van at a 25% reducing balance rate:

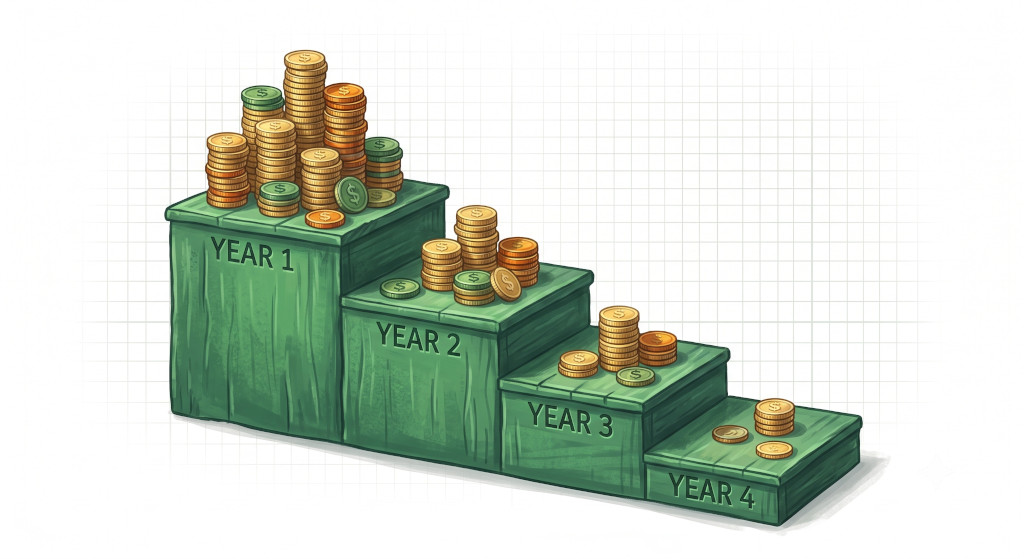
    • Year 1: £24,000 × 25% = £6,000 depreciation → NBV £18,000
    • Year 2: £18,000 × 25% = £4,500 depreciation → NBV £13,500
    • Year 3: £13,500 × 25% = £3,375 depreciation → NBV £10,125
    • Year 4: £10,125 × 25% = £2,531 depreciation → NBV £7,594

    Notice that the reducing balance method never technically reaches zero — or even the residual value — purely through the formula. In practice, businesses either adjust the final year’s charge or switch to straight-line in the last period to bring the asset down to its residual value.

    The reducing balance method suits assets that are more productive and more valuable in their early years — vehicles, computers, and technology equipment all tend to lose more of their economic value in the first few years of use than in later years.

    Worked Example — Fernwood Interiors Ltd

    Fernwood Interiors Ltd purchases a delivery van on 1 January for £24,000. The expected useful life is 4 years and the estimated residual value is £4,000. The table below shows the depreciation charge and net book value under both methods across the full useful life.

    YearStraight-Line Charge (£)Straight-Line NBV (£)Reducing Balance Charge (£)Reducing Balance NBV (£)
    Start24,00024,000
    Year 15,00019,0006,00018,000
    Year 25,00014,0004,50013,500
    Year 35,0009,0003,37510,125
    Year 45,0004,0002,5317,594
    Total depreciated20,0004,000 ✓16,4067,594

    The straight-line method depreciates the full depreciable amount (£20,000) exactly, landing precisely on the residual value of £4,000. The reducing balance method at 25% has depreciated £16,406 over four years — the van still carries an NBV of £7,594 at year end, above its estimated residual value. Fernwood’s accountant would adjust the rate or the final year’s charge to align the NBV with the expected disposal proceeds.

    The key takeaway from this table: reducing balance front-loads the depreciation charge. In years one and two, the income statement carries a higher expense under reducing balance — which lowers reported profit in those early years but results in lower charges later when the asset is older and perhaps more prone to maintenance costs.

    Which Method Should You Use?

    The choice of depreciation method should reflect how the asset actually loses value and how evenly it contributes to generating revenue over its life. There is no single correct answer — it depends on the type of asset and the accounting standards your business follows.

    Under UK GAAP (FRS 102) and IFRS, businesses must apply a depreciation method that reflects the pattern of consumption of the asset’s economic benefits. In practice, most UK SMEs default to straight-line for simplicity, while businesses with significant vehicle fleets or technology assets often use reducing balance to better match the reality of how those assets depreciate in the real world.

    For tax purposes in the UK, the rules are different. HMRC does not allow businesses to deduct accounting depreciation as a tax expense. Instead, capital allowances — specifically the Annual Investment Allowance (AIA) and Writing Down Allowances (WDAs) — govern how much of a capital purchase can be deducted for tax. The WDA rates (currently 18% for the main pool and 6% for special rate assets) broadly follow a reducing balance approach. This means your accounting depreciation and your tax relief will rarely match exactly in any given year, creating temporary timing differences on your tax computation. For a full breakdown of how capital and revenue expenditure interact with tax, see our guide on capital vs revenue expenditure.

    Once you’ve chosen a method for a class of asset, consistency matters. Switching depreciation methods between periods is permitted under accounting standards but requires disclosure in the financial statements and must be justified as providing more reliable and relevant information. Frequent switches are a red flag for auditors and will raise questions about whether the change is economically justified or cosmetically motivated.

    How Depreciation Appears in the Financial Statements

    Depreciation touches three of your key financial statements, and understanding where it appears in each is important for reading your accounts accurately.

    On the income statement, depreciation appears as an operating expense — usually within administrative expenses or cost of sales, depending on the nature of the asset. It reduces your operating profit and your net profit for the period.

    On the balance sheet, fixed assets are shown at cost less accumulated depreciation — that figure is the net book value. The longer you’ve held an asset and the faster it depreciates, the lower its NBV relative to its original cost. See our guide to understanding the balance sheet for how non-current assets are presented.

    On the cash flow statement (indirect method), depreciation is added back to operating profit in the reconciliation section. Because it is a non-cash charge — no money actually left the business in the period — it must be reversed out of profit to arrive at the true cash generated from operations.

    Key Takeaways

    • Depreciation spreads the cost of a fixed asset across its useful life, matching the expense to the periods in which the asset generates income.
    • The straight-line method charges an equal amount each year — simple, predictable, and suited to assets that provide even benefit over time.
    • The reducing balance method charges a fixed percentage on the declining net book value — front-loading the expense and better reflecting how some assets (vehicles, technology) lose value rapidly in early years.
    • The choice of method should reflect how the asset is actually consumed, not what produces the most convenient profit figure.
    • Depreciation is a non-cash item — it reduces profit but has no direct impact on your bank balance in the period it is charged.
    • For tax purposes in the UK, capital allowances (not accounting depreciation) determine how much of a capital purchase is deductible — these figures will rarely match your accounting charge.

    Related reading: If you found this guide useful, you may also want to read our posts on capital vs revenue expenditureunderstanding the balance sheettrial balance explained, and understanding the income statement.

  • What Is a Trial Balance? A Clear Guide for Small Business Owners

    What Is a Trial Balance? A Clear Guide for Small Business Owners

    Every set of books has a moment of reckoning — the point where you check whether everything you’ve recorded actually adds up. That moment is the trial balance. It’s one of the most important steps in the accounting cycle, yet it’s often misunderstood or skipped entirely by small business owners who rely on software to do the maths for them. Understanding what a trial balance is, how it works, and what it can and can’t tell you is a fundamental part of knowing whether your financial records are in good shape.

    What Is a Trial Balance?

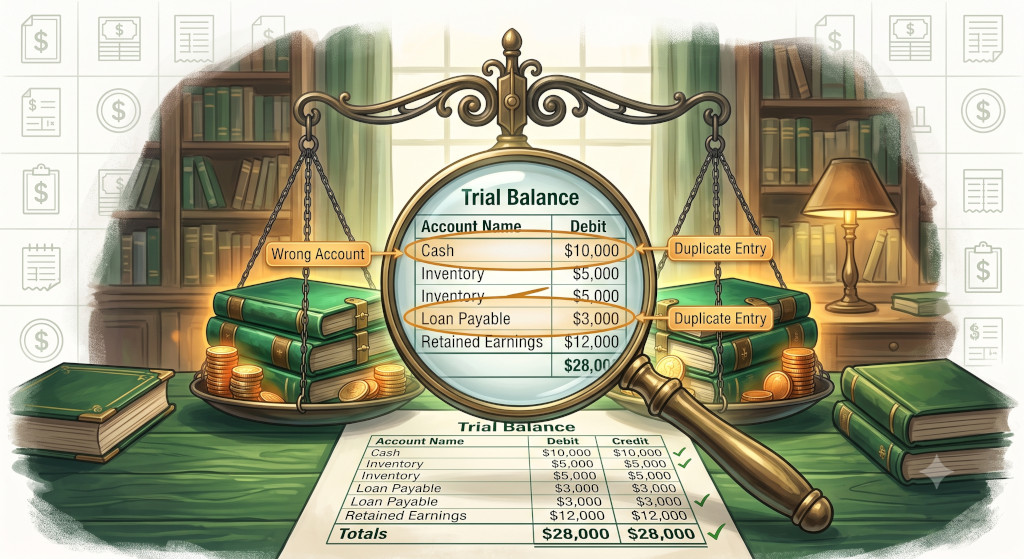
    A trial balance is a summary of all the balances in your general ledger at a specific point in time, arranged into two columns: debits on the left and credits on the right. If your double-entry bookkeeping has been done correctly, the two columns must always add up to the same total. That equality is the whole point.

    The name comes from an older accounting tradition — you were literally “trialling” (testing) whether your books balanced before preparing the final financial statements. Today it sits at the heart of the accounting cycle, acting as a checkpoint between your daily transaction recording and the production of your income statement and balance sheet.

    A trial balance doesn’t tell you whether your accounts are correct — it tells you whether they balance. That’s a crucial distinction, and one every business owner should understand.

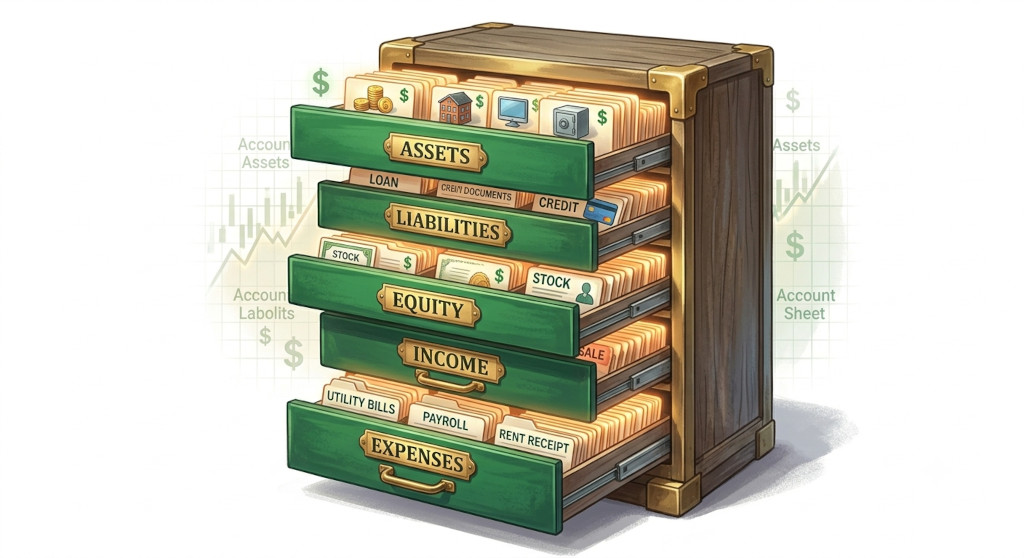
    A trial balance lists every account in your chart of accounts — assets, liabilities, equity, income, and expenses — alongside its closing debit or credit balance. Every pound, dollar, or unit of currency entered as a debit somewhere must appear as a credit somewhere else. If the two columns don’t match, there is a bookkeeping error that must be found and corrected before financial statements can be produced.

    How to Prepare a Trial Balance

    Preparing a trial balance is a straightforward process once you have your ledger accounts up to date. Most accounting software will generate one automatically, but understanding the manual steps helps you interpret what you’re looking at.

    Step 1 — Close off each ledger account. For every account in your general ledger, calculate the net balance. If debits exceed credits in an account, it has a debit balance. If credits exceed debits, it has a credit balance.

    Step 2 — List every account. Set up a three-column schedule: account name, debit balance, and credit balance. Every account gets one row. An account only ever appears in one column — never both.

    Step 3 — Know which column each account type belongs in. Assets and expenses normally carry debit balances. Liabilities, equity, and income normally carry credit balances. Contra accounts (such as accumulated depreciation or an allowance for doubtful debts) sit in the opposite column to their parent account.

    Step 4 — Total both columns. Add up the debit column and the credit column separately. If the totals agree, your books balance for that period. If they don’t, you have at least one error to find.

    Step 5 — Investigate any difference. A difference that is divisible by 9 often indicates a transposition error (e.g. entering £364 as £346). A difference that is exactly double a known figure often means a single entry was posted twice — or not at all — on one side.

    Worked Example — Oakfield Trading Ltd

    Oakfield Trading Ltd is a small wholesale business at the end of its first month of trading. The bookkeeper has posted all transactions and now prepares the trial balance to check whether the ledger is in order before producing the month-end income statement and balance sheet.

    AccountDebit (£)Credit (£)
    Cash at bank14,200
    Trade receivables8,500
    Inventory6,300
    Office equipment4,000
    Accumulated depreciation — equipment400
    Trade payables5,200
    Bank loan10,000
    Share capital12,000
    Retained earnings0
    Sales revenue22,400
    Cost of goods sold11,800
    Rent expense2,100
    Wages expense2,700
    Depreciation expense400
    TOTAL£50,000£50,000

    Both columns total £50,000. The ledger balances. Oakfield’s bookkeeper can now proceed with confidence to prepare the income statement (using the revenue and expense accounts) and the balance sheet (using the asset, liability, and equity accounts).

    Notice that accumulated depreciation appears in the credit column even though it relates to an asset. It is a contra-asset account — it offsets the gross value of the office equipment rather than being listed separately as a debit. This is normal treatment and one of the areas that most often confuses people new to trial balances.

    The Three Types of Trial Balance

    The term “trial balance” doesn’t always refer to the same document. There are three distinct versions, each used at a different stage of the period-end process.

    Unadjusted trial balance. This is the trial balance produced directly from the ledger before any period-end adjustments are made. It captures the raw balances as posted throughout the period — but it won’t yet reflect accruals, prepayments, depreciation charges, or provisions. This is your starting point.

    Adjusted trial balance. Once all period-end adjustments have been journalled and posted — accrued expenses, prepaid costs, depreciation, and so on — you produce an adjusted trial balance. This version gives a more accurate picture of the business’s financial position and is the document used to prepare the final financial statements. If you’re unfamiliar with accruals and prepayments, our guide on accruals and prepayments explained covers the adjusting entries in detail.

    Post-closing trial balance. After the financial statements have been produced and the temporary accounts (income and expenses) have been closed off to retained earnings, a final trial balance is prepared. This confirms that only permanent accounts — assets, liabilities, and equity — remain open going into the next period. It acts as the opening position for the new reporting cycle.

    What a Trial Balance Won’t Catch

    A balanced trial balance is a good sign, but it is not a guarantee of accuracy. There are several categories of error that leave both columns perfectly equal despite the underlying records being wrong.

    Errors of omission. If a transaction is simply not recorded at all — neither the debit nor the credit — both columns remain equal. The trial balance won’t flag it.

    Errors of commission. If a transaction is posted to the wrong account but the correct side — for example, rent expense debited to wages expense — the columns still balance. You’ve posted to the right type of account (both are expenses) but to the wrong one specifically.

    Compensating errors. If two separate mistakes cancel each other out — one overstatement and one understatement of equal amounts — the trial balance will appear balanced despite two underlying errors.

    Errors of principle. Posting a capital expenditure to the income statement as a revenue expense is a classic example. The debit and credit are technically correct, but the accounting treatment violates the principle of how capital items should be handled. The trial balance has no way of detecting this.

    For multi-entity businesses, the challenge is compounded — a balanced trial balance in each subsidiary doesn’t mean the consolidated group position is clean. BrizoConsol’s guide on how to prepare for audit with consolidated financials covers the additional layer of checks required when combining trial balances across multiple entities.

    Trial Balance vs Balance Sheet

    A common point of confusion is the difference between a trial balance and a balance sheet. They contain overlapping information, but they serve very different purposes.

    The trial balance includes every account — assets, liabilities, equity, income, and expenses — in one comprehensive list. It is an internal working document, not a formal financial statement. It is used by accountants and bookkeepers to verify the ledger before producing anything external.

    The balance sheet, by contrast, includes only the permanent accounts — assets, liabilities, and equity — and presents them in a structured format designed to be read by stakeholders. Income and expense accounts don’t appear on the balance sheet; their net result flows through to retained earnings. The balance sheet is a formal financial statement. The trial balance is the step that comes before it.

    Key Takeaways

    • A trial balance lists every general ledger account balance in debit and credit columns. If total debits equal total credits, your books balance for the period.
    • It is produced at three stages: unadjusted (before period-end entries), adjusted (after accruals and prepayments), and post-closing (after income and expense accounts are closed).
    • A balanced trial balance does not mean your records are error-free — it only means there are no unmatched debit/credit postings. Errors of omission, commission, and principle can all hide within a balanced trial balance.
    • The trial balance is an internal working document. It feeds into the income statement and balance sheet but is not itself a formal financial statement.
    • In most accounting software, a trial balance is generated automatically — but understanding it manually helps you interpret results, spot anomalies, and troubleshoot discrepancies when they arise.

    Related reading: If you found this guide useful, you may also want to read our posts on double-entry bookkeeping explainedunderstanding the balance sheetaccruals and prepayments explained, and understanding the income statement.

  • Bad Debts and Provisions Explained: What to Do When Customers Don’t Pay

    Bad Debts and Provisions Explained: What to Do When Customers Don’t Pay

    Any business that sells on credit — invoicing customers and waiting for payment — will eventually face a customer who does not pay. It might be a long-standing client who runs into financial difficulty, a one-off customer who disputes the invoice, or a debtor who simply disappears. However it happens, the result is the same: money you recorded as income and carried as an asset on your balance sheet may not materialise. How you account for that risk — both before it crystallises and after it does — is the subject of bad debt accounting. Getting it right keeps your financial statements honest and ensures your profit is not overstated by income you are unlikely ever to collect.

    Two Concepts: Bad Debts and Doubtful Debts

    Before getting into the accounting, it is worth being clear on the distinction between two related but different concepts.

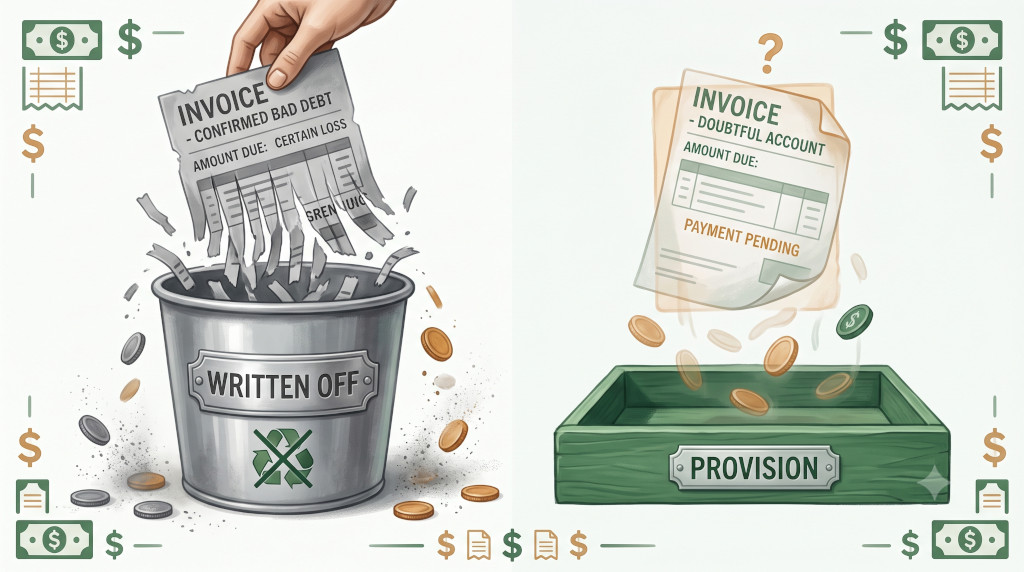
    bad debt is a specific debt that you have determined is irrecoverable. You have exhausted reasonable efforts to collect — chased the customer, involved a debt recovery agency, or learned the customer has gone into liquidation — and you have concluded the amount will not be received. At this point, you write the debt off: you remove it from your debtors (accounts receivable) and recognise the loss as an expense.

    doubtful debt is a debt where recovery is uncertain but not yet confirmed as impossible. The customer is overdue, in financial difficulty, or unresponsive — but you have not yet abandoned hope. Rather than waiting for certainty, prudent accounting requires you to create a provision for doubtful debts: an estimate of the amount you may not collect, recognised as an expense now, while the debtor balance remains on the books.

    Key insight: The difference is certainty. A bad debt write-off is definitive — the debt is gone. A provision for doubtful debts is an estimate — the debt is still there on the balance sheet, but its net value is reduced to reflect the risk of non-collection. Both are applications of the prudence concept: do not overstate assets or income.

    Writing Off a Bad Debt: The Accounting Entries

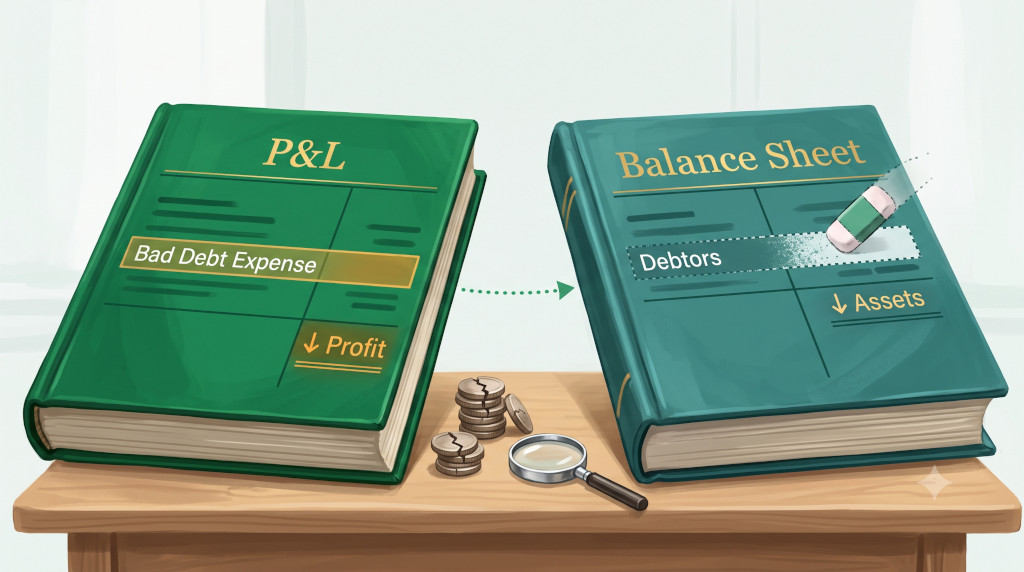
    When you decide a specific debt is irrecoverable and write it off, the journal entry removes the debtor from the balance sheet and records the loss as an expense.

    Assuming a customer owes £1,500 and you have concluded the debt is bad:

    AccountDebitCreditExplanation
    Bad Debt Expense (P&L)£1,500Records the loss as an expense, reducing profit
    Accounts Receivable / Debtors (Balance Sheet)£1,500Removes the uncollectable debt from current assets

    The effect: profit falls by £1,500, and the debtors balance on the balance sheet falls by £1,500. The original sale revenue recorded when the invoice was raised is not reversed — revenue was recognised when earned. The write-off records the subsequent failure to collect as a separate loss.

    What If the Customer Later Pays?

    Occasionally a debt written off is subsequently recovered — the customer pays after all. In this case, you reverse the write-off (reinstating the debtor) and then record the cash receipt in the usual way. The recovery is recorded as income — typically in a “bad debts recovered” account — so it is transparent in the accounts rather than buried.

    Creating a Provision for Doubtful Debts

    A provision takes a forward-looking view: rather than waiting for specific debts to become irrecoverable, you estimate the proportion of your overall debtor book that is unlikely to be collected, and recognise that estimate as a provision (a liability reducing the net debtor balance) before the outcome is known.

    There are two common approaches to calculating the provision.

    Specific Provision

    You identify individual debtors that are at risk and estimate the amount unlikely to be recovered from each. This is the most accurate method and is required under accounting standards (IFRS 9 and FRS 102’s expected credit loss model) for any material balance. For example, if Customer A owes £8,000 and is known to be in administration, you might provide for 80% of the balance: a provision of £6,400.

    General (Percentage) Provision

    Alternatively, you apply a percentage to the aged debtor balance to estimate overall expected losses. The percentage might be based on historical experience — if 2% of your debtors typically prove irrecoverable over time, you provision at 2%. This approach is less precise but practical for businesses with large numbers of small balances where individual assessment is impractical.

    Many businesses use a tiered approach based on how long each debt has been outstanding:

    Age of DebtProvision RateRationale
    0–30 days overdue0%Recent — expected to collect in normal course
    31–60 days overdue5%Slightly late — low but non-zero risk
    61–90 days overdue20%Noticeably overdue — elevated risk
    91–180 days overdue50%Significantly overdue — material risk of loss
    Over 180 days overdue90%Likely irrecoverable — consider specific write-off

    Provision Journal Entries

    When you create or increase a provision for doubtful debts:

    AccountDebitCreditExplanation
    Bad Debt Expense / Doubtful Debt Expense (P&L)£XReduces profit by the estimated loss
    Provision for Doubtful Debts (Balance Sheet — contra asset)£XReduces the net debtor balance presented on the balance sheet

    The provision sits as a contra asset — it does not remove the gross debtor balance (the customer still owes the money), but it reduces the net amount shown, reflecting that not all of it is expected to be collected. On the balance sheet, you might see: Trade Debtors £45,000 less Provision for Doubtful Debts (£2,700) = Net Debtors £42,300.

    At each period end, the provision is reviewed and adjusted — increased if the debtor book has grown or aged, decreased if collections have improved or specific debts have been written off against it.

    Worked Example: Thornfield Design

    Thornfield Design is a creative agency. At 31 March 2026 (year-end), the debtors ledger shows a total balance of £62,000. The bookkeeper analyses the age of the debt and identifies the following:

    CustomerAmount OwedStatusTreatment
    Client A£4,200In liquidation — no recovery expectedWrite off in full as bad debt
    Client B£9,000120 days overdue, disputing invoiceSpecific provision: 50% = £4,500
    Remaining debtors£48,800Mix of 0–90 days overdueGeneral provision at 3% = £1,464

    Step 1 — Write off Client A:
    Debit Bad Debt Expense £4,200 / Credit Debtors £4,200.
    Debtors balance falls to £57,800.

    Step 2 — Create provision for Client B and general book:
    Total provision required: £4,500 + £1,464 = £5,964.
    Debit Doubtful Debt Expense £5,964 / Credit Provision for Doubtful Debts £5,964.

    Balance sheet presentation at 31 March 2026:

    Item£
    Trade debtors (gross, after write-off)57,800
    Less: Provision for doubtful debts(5,964)
    Net trade debtors51,836

    P&L impact: Total bad debt and doubtful debt expense for the year = £4,200 + £5,964 = £10,164, reducing gross profit by that amount.

    VAT on Bad Debts

    For VAT-registered businesses in the UK, there is an additional consideration. When you originally raised the invoice, you paid VAT to HMRC on that sale. If the debt becomes irrecoverable and you write it off, you may be eligible to claim Bad Debt Relief — reclaiming the VAT you already paid over to HMRC on the unpaid invoice. To qualify, the debt must be more than six months old from the date payment was due, must have been written off in your accounts, and you must have originally accounted for VAT on the supply. Keep records of the original invoice, the write-off, and your VAT claim.

    Why This Matters for Your Management Accounts

    Bad debt accounting is not just a year-end tidying exercise — it affects how you read your monthly management accounts throughout the year. An accounts receivable balance that includes large amounts of aged, uncollected debt overstates your current assets and makes the business look more liquid than it actually is. Our guide to accounts receivable and accounts payable covers the broader mechanics of managing your debtor book, including credit terms and collection processes that help prevent bad debts from arising in the first place.

    Running an aged debtor report monthly — and provisioning regularly rather than only at year-end — keeps your management accounts realistic and helps you spot credit risk early, before it becomes a write-off. For groups with multiple entities, ensuring consistent provisioning policies across subsidiaries is important for presenting a reliable consolidated picture; BrizoConsol’s guide on preparing for audit with consolidated financials discusses how these policy consistencies are scrutinised at the group reporting level.


    Key Takeaways

    • bad debt write-off removes a specific irrecoverable debt from the balance sheet and records it as an expense in the P&L, reducing profit. The original revenue is not reversed.
    • provision for doubtful debts estimates the amount of the debtor book unlikely to be collected, recognised as an expense before the outcome is certain. It sits as a contra asset, reducing the net debtor balance on the balance sheet.
    • The journal entries for a write-off: Debit Bad Debt Expense / Credit Debtors. For a provision: Debit Doubtful Debt Expense / Credit Provision for Doubtful Debts.
    • Provisions can be specific (applied to identified at-risk debtors) or general (a percentage applied to the aged debtor book), or a combination of both.
    • Review and adjust your provision at every period end — as debts age, are recovered, or are written off, the provision should move accordingly.
    • VAT-registered businesses in the UK may be able to reclaim VAT on written-off debts via Bad Debt Relief, subject to qualifying conditions.
    • Regular aged debtor reporting and timely provisioning keeps your management accounts honest and surfaces credit risk early.

    Related Reading

  • Inventory Valuation Methods Explained: FIFO, LIFO, and AVCO for SMEs

    Inventory Valuation Methods Explained: FIFO, LIFO, and AVCO for SMEs

    If your business buys and sells physical goods, one question sits quietly at the centre of your accounts: when you sell a unit of stock, which cost do you use to calculate your profit? This might sound like a technicality, but the answer can produce materially different profit figures, different balance sheet values, and different tax bills — all from the same physical reality of goods bought and sold. The choice of inventory valuation method determines how you assign the cost of goods to the units you sell (reducing profit) versus the units still sitting in your warehouse (remaining on the balance sheet). Three methods dominate in practice: FIFO, LIFO, and AVCO. Understanding how each works — and which applies to your business — is essential for any SME that holds stock.

    Why Inventory Valuation Matters

    Before exploring the three methods, it helps to be clear about what inventory valuation is actually doing. When you buy stock at different times, you often pay different prices. Supplier costs change, exchange rates fluctuate, and bulk discounts vary. At the end of any period, your warehouse might hold identical products that were purchased at £10, £12, and £14 per unit at different points in time.

    When you sell one of those units, which cost flows through to your Cost of Goods Sold (COGS) on the profit and loss account — and which remains as closing stock on your balance sheet? The inventory valuation method you choose answers this question. And because COGS directly drives gross profit, and closing stock directly affects the balance sheet and therefore equity, the choice of method is not neutral. In a period of rising prices, different methods produce genuinely different financial results from the same underlying transactions.

    You can read more about how COGS is calculated and why it matters in our guide to Cost of Goods Sold explained.

    FIFO: First In, First Out

    FIFO assumes that the oldest units of stock are sold first. The cost assigned to goods sold is the cost of the earliest purchases; the cost of the most recent purchases remains in closing stock.

    In physical terms, FIFO mirrors how most perishable goods businesses actually operate — a bakery sells yesterday’s bread before today’s, and a grocer rotates stock so the oldest items face the front. But as an accounting assumption, FIFO applies even when there is no physical rotation — it is purely about which cost flows out first.

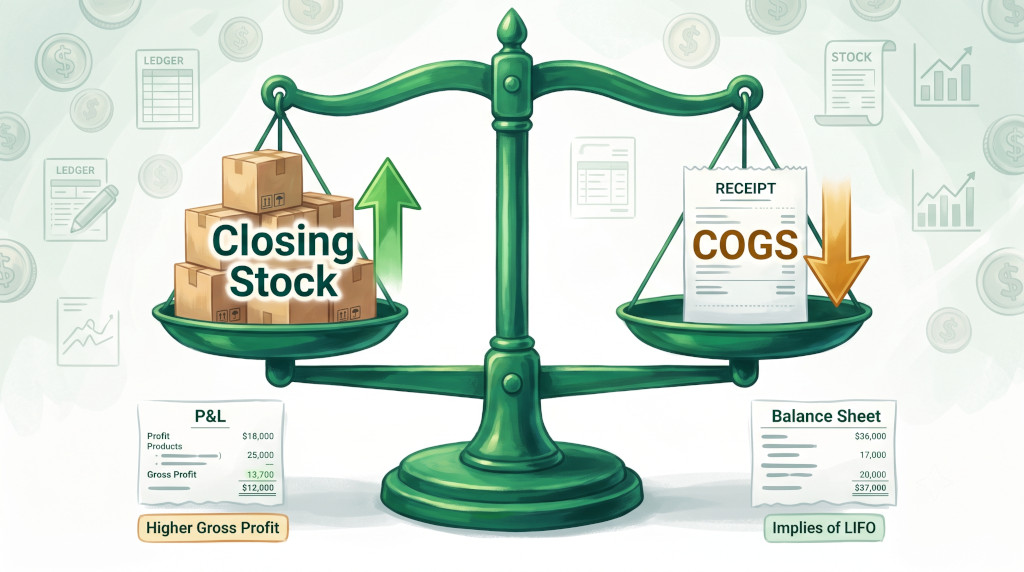
    In a period of rising prices, FIFO produces a lower COGS (because cheaper older stock is expensed first) and a higher closing stock value (because more expensive recent purchases remain). The result is a higher gross profit. The balance sheet shows closing stock at the most current costs, making it a realistic reflection of what that stock would cost to replace.

    FIFO is permitted under both UK GAAP (FRS 102) and IFRS. For most product-based SMEs in the UK and internationally, it is the default method.

    LIFO: Last In, First Out

    LIFO assumes the opposite: the most recently purchased stock is sold first. The cost of the newest units flows through to COGS; the oldest (and typically cheapest, in a rising market) costs remain in closing stock.

    In a period of rising prices, LIFO produces a higher COGS and lower gross profit — because the most expensive recent purchases are expensed first. Closing stock is valued at older, cheaper prices, which means the balance sheet understates the current replacement cost of inventory.

    The US has historically permitted LIFO under US GAAP, and some US businesses have used it specifically because higher COGS in inflationary periods reduces taxable income. However, LIFO is prohibited under IFRS and under UK GAAP (FRS 102). If your business reports under IFRS or UK GAAP — as most UK companies do — LIFO is not an available option. It is worth understanding for completeness, particularly if you work with US-based groups or encounter it in comparative analysis.

    Key insight: Under IFRS and UK GAAP, the permitted inventory cost methods are FIFO and Weighted Average Cost (AVCO). LIFO is explicitly prohibited. Choosing between FIFO and AVCO is therefore the practical decision for most UK SMEs.

    AVCO: Weighted Average Cost

    AVCO (Weighted Average Cost, also called WAC or the average cost method) takes a different approach entirely. Rather than tracking which specific batch was sold first or last, it calculates a weighted average cost across all units in stock and applies that single average cost to every unit sold and every unit remaining.

    The weighted average is recalculated each time new stock is purchased:

    New Average Cost = (Value of Existing Stock + Cost of New Purchase) ÷ (Existing Units + New Units)

    Each sale then uses the current average cost to calculate COGS, and the remaining stock is carried at that same average. When the next purchase arrives, the average is recalculated again.

    AVCO smooths out price fluctuations. In a rising market, it produces a COGS and gross profit between what FIFO and LIFO would generate. It avoids the distortions of either extreme and is particularly suited to businesses with homogeneous, interchangeable stock where tracking individual batches is impractical.

    Worked Example: Kestrel Components

    Kestrel Components buys and sells an industrial fastener. During June, the following transactions occur:

    DateTransactionUnitsUnit CostTotal
    1 JunOpening stock100£10.00£1,000
    8 JunPurchase150£12.00£1,800
    15 JunSale180
    22 JunPurchase100£14.00£1,400
    28 JunSale100

    At month-end, 70 units remain in stock (100 + 150 − 180 + 100 − 100 = 70). The question is: what is the COGS for the 280 units sold, and what is the value of the 70 units remaining?

    Under FIFO

    First sale (180 units): use 100 units at £10.00 (all opening stock), then 80 units at £12.00. COGS = (100 × £10) + (80 × £12) = £1,000 + £960 = £1,960.

    Second sale (100 units): use the remaining 70 units at £12.00, then 30 units at £14.00. COGS = (70 × £12) + (30 × £14) = £840 + £420 = £1,260.

    Total COGS: £3,220. Closing stock: 40 units at £14.00 = £560.

    Under AVCO

    After the 8 June purchase: average cost = (£1,000 + £1,800) ÷ (100 + 150) = £2,800 ÷ 250 = £11.20 per unit.

    First sale (180 units): COGS = 180 × £11.20 = £2,016. Remaining: 70 units × £11.20 = £784.

    After the 22 June purchase: new average = (£784 + £1,400) ÷ (70 + 100) = £2,184 ÷ 170 = £12.85 per unit.

    Second sale (100 units): COGS = 100 × £12.85 = £1,285. Closing stock: 70 units × £12.85 = £899.50.

    Total COGS: £3,301.

    Side-by-Side Comparison

    MethodTotal COGSClosing Stock ValueGross Profit Impact
    FIFO£3,220£560Higher (lower COGS)
    AVCO£3,301£899.50Lower (higher COGS)
    LIFO (illustrative only — not permitted under IFRS/UK GAAP)£3,580£200Lowest (highest COGS)

    Note that the total cost of goods available for sale is the same under all three methods: £1,000 + £1,800 + £1,400 = £4,200. The difference is only in how that total is split between COGS and closing stock. COGS + Closing Stock always equals the total available — the method simply determines the allocation.

    Choosing the Right Method for Your Business

    For UK and IFRS-reporting businesses, the practical choice is between FIFO and AVCO. Here is how to think about it.

    FIFO is well suited to businesses where stock physically rotates — food, pharmaceuticals, perishables, time-sensitive goods. It produces a closing stock value closest to current replacement cost, making the balance sheet more meaningful to lenders and investors. In periods of rising prices, it reports higher profits — which can be an advantage for demonstrating financial performance but also means a higher tax liability.

    AVCO is well suited to businesses with homogeneous, interchangeable stock where individual batch tracking is impractical — bulk commodities, raw materials, components. It smooths volatility in reported profit caused by price fluctuations, which can make period-to-period comparisons more stable. It is also simpler to operate in a perpetual inventory system that recalculates the average with each purchase.

    The single most important rule is consistency: whichever method you choose must be applied consistently from period to period. Switching methods is permitted under accounting standards but requires disclosure and restatement of prior period comparatives — it is not a mechanism for managing reported profit in a given year. Any change must be justified as producing more reliable and relevant information, and the impact disclosed in the notes to the accounts.

    For businesses operating across multiple entities — where one subsidiary might historically have used FIFO and another AVCO — consolidating group accounts requires harmonising inventory policies. This is one of many accounting policy alignment challenges that multi-entity finance teams encounter at the group reporting level.


    Key Takeaways

    • Inventory valuation determines which purchase cost flows to COGS (reducing profit) and which remains in closing stock (on the balance sheet). The same physical stock can produce different profit figures depending on the method used.
    • FIFO (First In, First Out) assumes oldest stock is sold first. In rising prices, it produces lower COGS, higher gross profit, and closing stock valued at current prices.
    • LIFO (Last In, First Out) assumes newest stock is sold first. It is prohibited under IFRS and UK GAAP and should not be used by businesses reporting under these standards.
    • AVCO (Weighted Average Cost) calculates a running average cost and applies it to all sales. It smooths out price fluctuations and sits between FIFO and LIFO in profit impact.
    • COGS + Closing Stock always equals the total cost of goods available for sale — the method only determines how that total is allocated between the two.
    • Whichever method you choose must be applied consistently. Switching requires justification and disclosure — it cannot be used to manage reported profit.
    • UK SMEs reporting under FRS 102 or IFRS should use FIFO or AVCO. Confirm with your accountant which best fits your business’s stock characteristics and reporting needs.

    Related Reading

    Inventory valuation sits at the intersection of cost accounting, profit reporting, and balance sheet management. These ARD guides provide the context around it:

  • Capital Expenditure vs Revenue Expenditure: What’s the Difference and Why It Matters for Your Business

    Capital Expenditure vs Revenue Expenditure: What’s the Difference and Why It Matters for Your Business

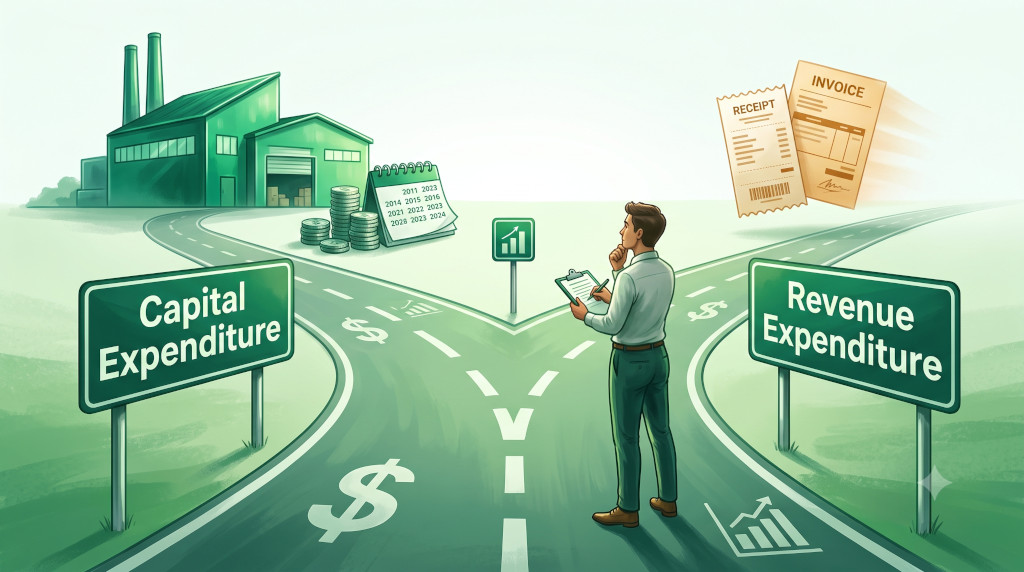
    When a business spends money, not every payment is treated the same way in the accounts. A £300 printer cartridge and a £30,000 piece of manufacturing equipment are both costs — but they land in completely different places in your financial statements, affect your profit in entirely different ways, and have different tax implications. The distinction that determines how each is treated is one of the most fundamental in accounting: is this capital expenditure or revenue expenditure? Getting this right matters not just for producing accurate accounts, but for ensuring you claim the right tax reliefs at the right time and present an honest picture of your business’s assets and profitability.

    What Is Capital Expenditure?

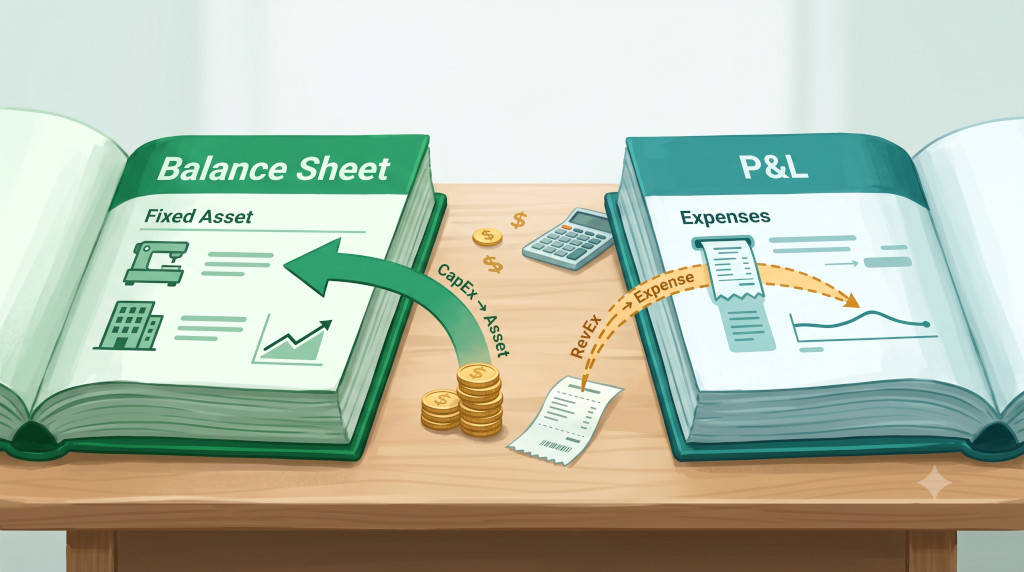
    Capital expenditure (CapEx) is spending on assets that will provide economic benefit to your business over more than one accounting period. When you buy a piece of machinery, a company vehicle, a building, computer equipment, or any other asset with a multi-year useful life, that is capital expenditure.

    The defining characteristic is duration: the asset will contribute to generating revenue not just now, but in future periods too. Because of this, accounting standards require that the cost is not written off immediately against profit. Instead, it is recognised as an asset on the balance sheet and then gradually expensed over the asset’s useful life through depreciation. This matching of cost to benefit — spreading the expenditure across the periods in which the asset earns its keep — is the practical application of the matching principle discussed in our guide to double-entry bookkeeping and journal entries.

    Common examples of capital expenditure include property purchases or improvements, machinery and equipment, vehicles, computer hardware, leasehold improvements, and the development costs of software or other intangible assets (subject to specific criteria).

    What Is Revenue Expenditure?

    Revenue expenditure (sometimes called operational expenditure or OpEx) is spending that is consumed within the current accounting period. It relates to the day-to-day running of the business: rent, utilities, wages, stationery, repairs, insurance, advertising, and similar costs. These expenses are charged directly to the profit and loss account in the period they are incurred, reducing profit immediately.

    The key distinction from capital expenditure is that revenue expenditure either has no lasting economic benefit beyond the current period, or it relates to maintaining an existing asset rather than enhancing it. Painting your office walls is revenue expenditure (maintenance). Adding a new floor to the building is capital expenditure (enhancement).

    Key insight: The question to ask is: does this spending create or enhance a long-term asset, or does it simply keep the business running today? If it creates lasting value — it is CapEx, and it goes on the balance sheet. If it keeps operations running without creating a new asset — it is revenue expenditure, and it goes straight to the P&L.
    How the Classification Affects Your Accounts

    The accounting treatment for each type of expenditure is fundamentally different, and the impact flows through both the balance sheet and the profit and loss account.

    FeatureCapital ExpenditureRevenue Expenditure
    Where it goesBalance sheet (fixed assets)Profit & Loss account (expenses)
    Profit impactSpread over useful life via depreciationReduces profit immediately in full
    Cash impactFull cash outflow on purchase dateFull cash outflow when paid
    Balance sheet effectIncreases fixed assets (gross); reduces via accumulated depreciationNo balance sheet entry (passes through P&L)
    Tax treatment (UK example)Capital allowances claimed over timeDeducted in full in the year incurred
    ExampleBuying a delivery van for £25,000Insuring that van for £1,200 per year

    Note an important nuance: the cash impact is the same on day one regardless of classification. The company pays £25,000 for the van — the cash leaves the bank immediately. The difference is purely in how that outflow is recognised in the accounts: gradually through depreciation (CapEx) or all at once (revenue expenditure). This is why a business can be profitable on paper but still face cash pressure after a major capital investment — the profit and loss account only shows the year’s depreciation charge, while the full purchase price has already left the bank account.

    The Tax Dimension: Why Getting This Right Matters

    Misclassifying capital and revenue expenditure has direct tax consequences. In the UK, revenue expenditure is deductible in full in the accounting period it is incurred — reducing your taxable profit pound for pound. Capital expenditure is not deducted as an expense; instead, you claim capital allowances, which are the tax equivalent of depreciation (though calculated using HMRC’s own rates rather than your accounting depreciation charge).

    The Annual Investment Allowance (AIA) allows most SMEs to deduct the full cost of qualifying capital expenditure in the year of purchase — which can be highly tax-efficient. But to claim it, the expenditure must first be correctly classified as capital. If a business mistakenly treats capital expenditure as a revenue expense, it may claim a deduction it is not entitled to — which can result in penalties if HMRC identifies the error. Conversely, if it treats revenue expenditure as capital, it will under-claim in the current year and over-state its asset base.

    The tax rules vary by jurisdiction, so always confirm the treatment that applies to your business with a qualified accountant — but the principle that classification affects both your accounts and your tax position is universal.

    Worked Example: Birchwood Bakery

    Birchwood Bakery is a small food production business. In the financial year ending 31 March 2026, it incurs the following expenditures. The owner needs to classify each correctly before preparing the accounts.

    ItemCostClassificationReasoning
    New commercial oven£12,000CapitalLong-lived asset providing benefit over several years; goes to balance sheet, depreciated over useful life
    Annual service of existing oven£350RevenueMaintenance to keep existing asset running — does not enhance or extend its life materially
    New shelving unit for storage room£800CapitalPermanent fixture; enhances the business’s physical capacity over multiple years
    Flour, butter, and packaging (consumables)£9,200RevenueConsumed directly in producing goods for sale — expensed in the period as cost of goods sold
    Repainting the shopfront£1,100RevenueRestores to existing condition; does not increase the asset’s value or extend its useful life
    Website rebuild (new e-commerce features)£4,500CapitalEnhances and extends a long-term digital asset; capitalised and amortised over its expected useful life

    The two items that often cause confusion are the oven service and the shopfront repaint. Both involve spending on existing physical assets. The test is whether the spending restores the asset to its original condition (revenue) or improves or extends it (capital). A £350 annual service is clearly maintenance — it keeps the oven running as it should. If Birchwood instead upgraded the oven’s burner system to increase its capacity and extend its life by five years, that upgrade would be capital expenditure.

    Common Areas of Confusion

    Several categories of spending regularly cause uncertainty for SME owners and bookkeepers. Here are the most common grey areas.

    Repairs vs improvements. As noted above, the line between repairing an asset (revenue) and improving it (capital) is the most frequent source of misclassification. A new roof that replaces a damaged one like-for-like is arguably revenue; a roof replaced with a superior material that extends the building’s life is capital.

    Software. Purchased off-the-shelf software with a perpetual licence is typically capital expenditure. Software-as-a-Service (SaaS) subscription fees paid monthly or annually are revenue expenditure. The distinction matters enormously as more businesses shift to cloud-based tools — all those SaaS costs are P&L expenses, not assets.

    Low-value assets. Most businesses set a capitalisation threshold — a minimum cost below which items are expensed as revenue expenditure even if they technically meet the definition of an asset. A £50 stapler has an expected life of several years, but no business capitalises it. A common threshold for SMEs is £500 or £1,000 — spending below this is written off immediately. The threshold should be set consistently and disclosed in the accounting policies.

    Initial setup costs. Legal fees, installation costs, and delivery charges that are directly attributable to bringing a capital asset into use are generally added to the cost of the asset (capitalised) rather than expensed. The cost of an asset is everything required to get it into its working condition — not just the purchase price itself. You can read more about how assets are valued and carried in our guide to depreciation methods, which covers how capital assets are expensed over time.


    Key Takeaways

    • Capital expenditure is spending on assets that provide economic benefit over more than one accounting period. It goes on the balance sheet and is expensed gradually through depreciation.
    • Revenue expenditure is spending consumed within the current period — day-to-day running costs and maintenance. It goes directly to the profit and loss account and reduces profit in full immediately.
    • Cash leaves the business on the same day regardless of classification. The difference is in how and when the cost is recognised in the accounts.
    • Misclassification has tax consequences: revenue expenditure is typically deductible in full in the year incurred; capital expenditure is recovered through capital allowances over time (though reliefs like the Annual Investment Allowance can accelerate this).
    • The key test for any spending: does it create or enhance a long-term asset, or does it maintain the business’s existing ability to operate? Enhancement = capital; maintenance = revenue.
    • Most businesses set a capitalisation threshold — spending below a set amount is written off as revenue expenditure regardless of asset life. Apply this threshold consistently.
    • When in doubt about the correct classification, particularly for material amounts, consult a qualified accountant — the tax and reporting implications make this one area where getting it right from the outset is considerably easier than correcting it later.

    Related Reading

    Capital and revenue expenditure classification connects directly to how your balance sheet and profit and loss account are structured. These ARD guides provide the broader context:

  • Accruals and Prepayments Explained: The Accounting Entries Every SME Owner Needs to Understand

    Accruals and Prepayments Explained: The Accounting Entries Every SME Owner Needs to Understand

    If you have ever looked at a set of accounts and noticed entries for things like “accrued expenses” on the balance sheet or “prepayments” in the current assets section, you have encountered one of the most important — and most misunderstood — principles in accounting. Accruals and prepayments exist because of a fundamental rule: income and expenses must be recognised in the accounting period they belong to, not simply when money changes hands. For SME owners moving beyond basic bookkeeping, understanding this principle is the difference between accounts that tell you the truth about your business and accounts that give you a distorted picture of your profitability.

    Why Timing Matters in Accounting: The Matching Principle

    Most people think of money in terms of cash: you earn it when it lands in the bank and spend it when it leaves. But accrual accounting — the method required for most formal sets of accounts — operates on a different logic. It follows the matching principle: revenues and expenses should be matched to the period in which the underlying economic activity occurs, regardless of when the cash actually moves.

    Consider a simple example. You pay your business insurance for the year in January: £2,400 in a single lump sum. Under cash accounting, that entire cost hits your January profit and loss statement. Under accrual accounting, £200 of insurance cost is recognised each month — because each month you are using one month’s worth of cover. The remaining unused portion sits on the balance sheet as a prepayment (an asset — money you have paid for something you haven’t yet received).

    The matching principle produces accounts that reflect the economic reality of what happened during a period, rather than the happenstance of when payments were timed. It is why almost every business using formal accounts — whether to comply with company law, to present to a bank, or to get an accurate read on profitability — operates on an accruals basis.

    The Four Types: Accruals and Prepayments Unpacked

    There are four distinct adjustments that fall under the accruals and prepayments umbrella. Two relate to expenses; two relate to income.

    1. Accrued Expenses (Accruals)

    An accrued expense is a cost you have incurred during the accounting period but have not yet paid or received an invoice for. The economic event has happened; the cash has not moved yet.

    Common examples include electricity and gas bills that run to the end of the month but arrive several weeks later, wages for the final few days of a month that are paid in the following month, or professional fees for work completed but not yet invoiced. The cost belongs to the current period, so it must be recognised now — even without a payment or invoice to match.

    In double-entry terms, you debit the relevant expense account (increasing the expense in your P&L) and credit an “accruals” or “accrued expenses” liability on the balance sheet. When the payment eventually arrives, you reverse the accrual entry and record the actual payment.

    2. Prepaid Expenses (Prepayments)

    A prepaid expense is the mirror image: you have paid for something in advance that covers a future period. Part of the payment belongs to the current period; the remainder belongs to one or more future periods.

    Insurance paid annually, software subscriptions paid quarterly, and rent paid in advance are all classic prepayments. The portion relating to the current period is expensed through the P&L; the unused portion is held on the balance sheet as a current asset — money owed to you in the form of future economic benefit.

    3. Accrued Income

    Accrued income arises when you have earned revenue during the period but have not yet issued an invoice or received payment. You have delivered the service or supplied the goods; the income belongs to this period. A consultant who completes a project in December but invoices in January must still recognise the income in December under the accruals basis.

    The accounting entry records the income in the P&L and carries a corresponding debtor (receivable) on the balance sheet — an amount owed to the business that has not yet been formally invoiced.

    4. Deferred Income

    Deferred income is the opposite: you have received cash from a customer for something you have not yet delivered or earned. A deposit taken for a job not yet started, or an annual subscription received upfront, creates deferred income. The cash is in the bank, but the income is not yours yet — you still have an obligation to perform.

    On the balance sheet, deferred income sits as a liability. As you deliver the service or product over time, you recognise the income progressively through the P&L.

    Key insight: Accruals and prepayments are timing adjustments — they ensure the right amount of income and expense lands in the right accounting period, regardless of when money moves. At the end of every period, these entries are reviewed and reversed or updated as appropriate.

    How Accruals and Prepayments Appear in Your Financial Statements

    Once you understand the four types, it becomes straightforward to trace where they appear in a standard set of accounts.

    Entry TypeP&L EffectBalance Sheet Effect
    Accrued ExpenseIncreases expenses in the current periodCreates a liability (accruals / creditors)
    Prepaid ExpenseReduces expense recognised in the current periodCreates a current asset (prepayments)
    Accrued IncomeIncreases revenue in the current periodCreates a current asset (accrued income / debtors)
    Deferred IncomeReduces revenue recognised in the current periodCreates a liability (deferred income)

    If your balance sheet shows a line for prepayments under current assets, it represents money you have already paid for goods or services that relate to a future period — an economic benefit the business will receive. If it shows accruals under current liabilities, it represents costs already incurred that have not yet been settled in cash.

    A Worked Example: Hartley Studio

    Hartley Studio is a small creative agency preparing accounts for the financial year ending 31 March 2026. As the year-end approaches, the bookkeeper identifies four timing adjustments needed:

    SituationTypeP&L AdjustmentBalance Sheet
    Electricity bill for March not yet received — estimated £340Accrued Expense+ £340 utilities expense+ £340 accruals (liability)
    Annual software licence paid Jan 2026 — £1,200. 3 months remain after year-end.Prepaid Expense− £300 software expense (future months)+ £300 prepayments (asset)
    Design project delivered in March — client invoice not yet raised — £2,500Accrued Income+ £2,500 revenue+ £2,500 accrued income (asset)
    Deposit received in February for project starting April — £800Deferred Income− £800 revenue (not yet earned)+ £800 deferred income (liability)

    Without these four adjustments, Hartley Studio’s year-end accounts would understate expenses by £340, overstate expenses by £300 (software charged entirely to this year), miss £2,500 of revenue earned but not yet invoiced, and include £800 of revenue not yet earned. The net distortion would render the profit figure unreliable.

    Each of these adjustments is reversed at the start of the following period, and the actual transactions then replace them as they occur — a clean mechanism that keeps each period’s accounts accurate.

    Why Accruals and Prepayments Matter for Your Business

    For any SME preparing formal accounts — whether for Companies House, for a bank loan application, or simply for reliable management information — getting accruals and prepayments right is not optional. Here is why it matters in practice.

    Accurate profitability. If large expenses routinely hit the P&L in the wrong month, your monthly profit figures are noise rather than signal. A business that pays an annual insurance premium in January will show an apparently unprofitable January and falsely profitable months for the rest of the year — making it impossible to track trends or spot problems.

    Correct balance sheet values. Prepayments are genuine assets — cash you have committed that will generate future economic benefit. Accrued income is money you have genuinely earned. Omitting these distorts the balance sheet and can misrepresent the business’s financial position to lenders, investors or potential buyers.

    Reliable management accounts. If you use monthly management accounts to run your business, accruals and prepayments are what make those accounts comparable month to month. Without them, you are looking at a cash flow statement dressed up as a P&L. You can read more about the role of management accounts in our guide to management accounts vs statutory accounts.

    Audit readiness. Accruals are among the most scrutinised items in any audit. Poorly documented or missing accrual entries — particularly for material year-end expenses — are a common source of audit queries and adjustments. For businesses that consolidate across multiple entities, ensuring consistent accrual treatment across all subsidiaries is an additional layer of complexity; BrizoConsol’s guide on preparing for audit with consolidated financials covers how groups manage this at the reporting level.

    Tax implications. In most jurisdictions, taxable profit is calculated on an accruals basis. Misclassifying or omitting accruals can therefore affect the tax you report, potentially creating under- or over-payment that the tax authority may later challenge.


    Key Takeaways

    • Accruals and prepayments are timing adjustments that ensure income and expenses are recognised in the accounting period they belong to — not simply when cash moves. This is called the matching principle.
    • There are four types: accrued expenses (costs incurred but not yet paid), prepaid expenses (costs paid in advance for future periods), accrued income (revenue earned but not yet invoiced), and deferred income (cash received for services not yet delivered).
    • Accruals and prepayments create entries on both the P&L and the balance sheet: liabilities for costs owed or income received early, and assets for payments made in advance or income earned but not yet received.
    • Without these adjustments, monthly and annual accounts will misrepresent profitability, distort the balance sheet, and make period-to-period comparisons unreliable.
    • All accrual and prepayment entries are reversed at the start of the following period, and replaced by the actual transactions as they occur.
    • Accruals are among the most closely reviewed items in a year-end audit — accurate, well-documented entries significantly reduce the chance of adjustments.

    Related Reading

    Accruals and prepayments connect directly to how your financial statements are constructed and how your business records transactions. These ARD guides provide the essential context: