You can be turning a profit every month and still find yourself unable to pay your suppliers. It sounds contradictory, but it happens to small and medium-sized businesses all the time — and the culprit is almost always the same: poorly managed working capital. Understanding working capital, how it flows through your business, and how to keep it in good shape is one of the most practical financial skills any business owner or finance manager can develop. It is the difference between a business that grows with confidence and one that constantly scrambles to make payroll despite a full order book.
What Is Working Capital?
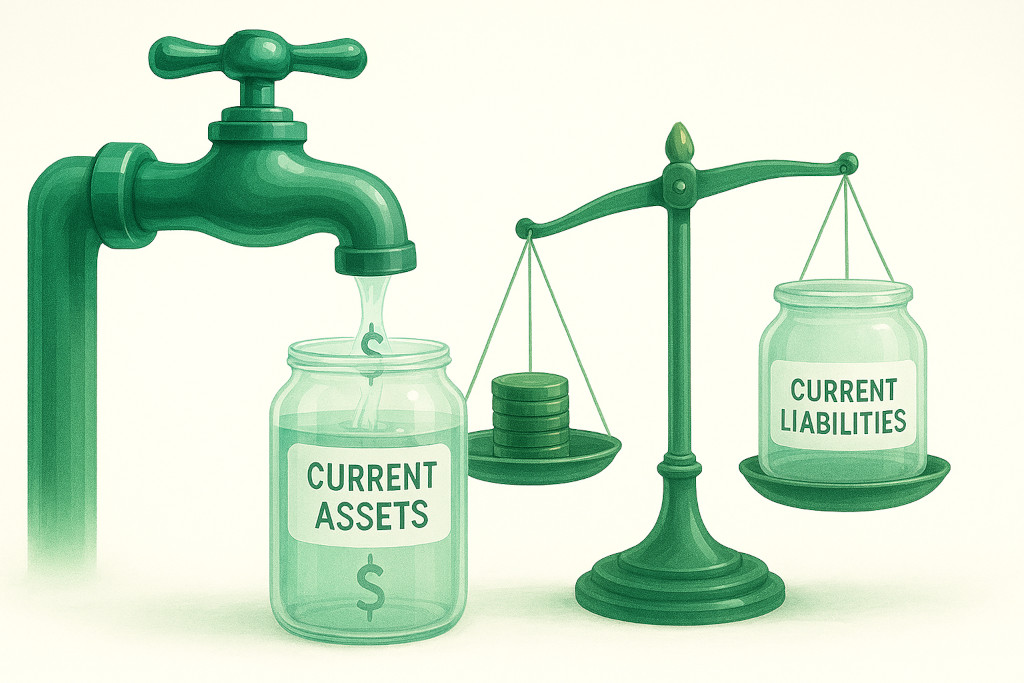
Working capital is the difference between your business’s current assets and its current liabilities. The formula is simple:
Working Capital = Current Assets − Current Liabilities
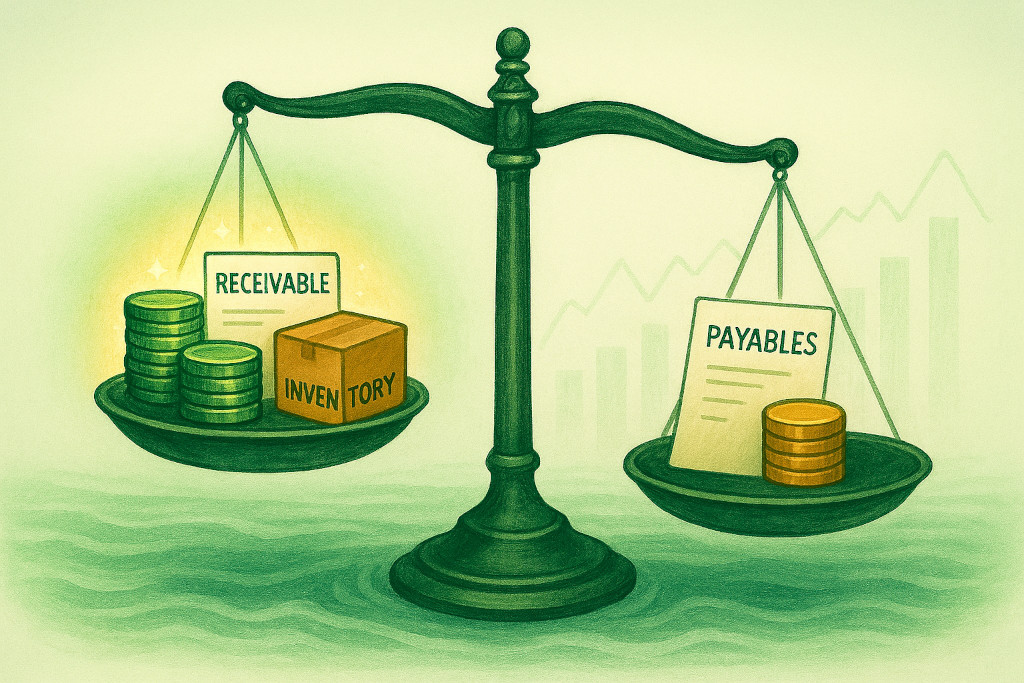
Current assets are resources your business expects to convert into cash within the next 12 months. They typically include cash and bank balances, accounts receivable (money owed to you by customers for goods or services already delivered), and inventory (stock held ready for sale or in production).
Current liabilities are obligations your business must settle within 12 months. These include accounts payable (what you owe to suppliers), short-term loans or credit facilities, and accrued expenses such as wages payable or VAT due.
If your current assets exceed your current liabilities, you have positive working capital — meaning you can meet your short-term obligations and have a financial cushion. If your liabilities outstrip your assets, you have negative working capital, which is a warning sign. Even a consistently profitable business can become insolvent if it runs out of working capital.
Here is a simplified example:
| Current Assets | Amount (£) | Current Liabilities | Amount (£) |
|---|---|---|---|
| Cash & Bank | 30,000 | Accounts Payable | 25,000 |
| Accounts Receivable | 45,000 | Short-Term Loan | 10,000 |
| Inventory | 20,000 | Accrued Expenses | 8,000 |
| Total Current Assets | 95,000 | Total Current Liabilities | 43,000 |
| Working Capital: £52,000 | |||
In this example, the business has a healthy working capital position of £52,000 — it can comfortably cover its short-term obligations and has funds available to invest in growth.
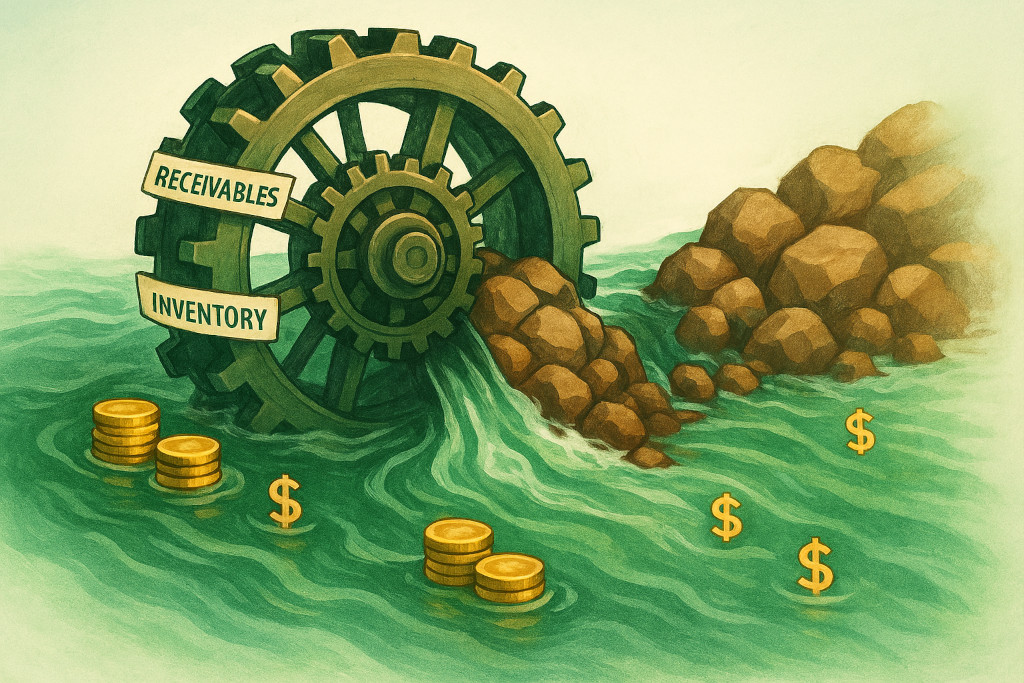
The Working Capital Cycle Explained
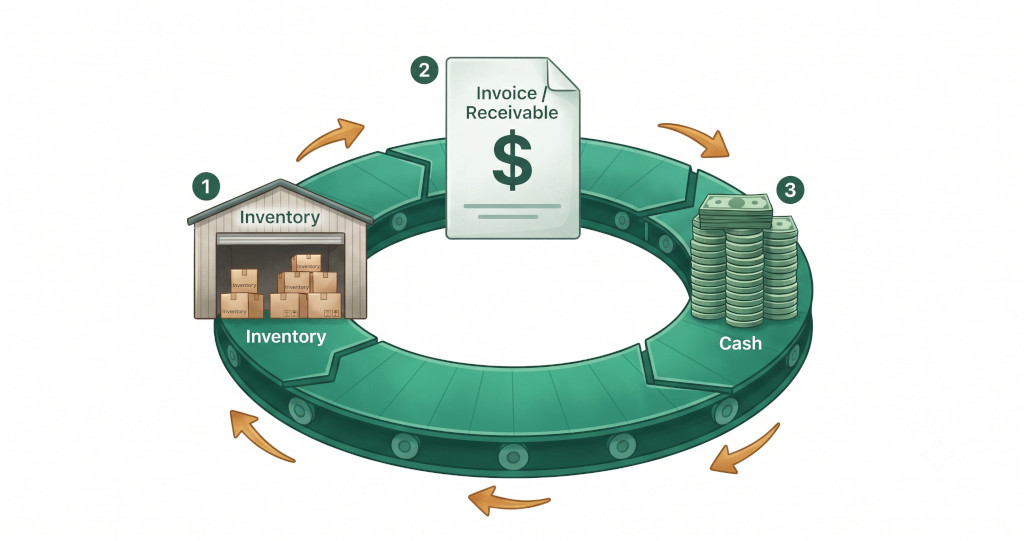
The working capital cycle (also called the cash conversion cycle) describes the journey your cash takes as it moves through your business operations. For most businesses, it flows in a predictable loop:
- You spend cash to purchase raw materials or finished goods (inventory).
- You sell the goods or deliver the service, creating a sale.
- You raise an invoice, which creates an account receivable — cash is owed to you but has not yet arrived.
- Your customer pays, converting the receivable back into cash.
- The cycle begins again.
The length of this cycle — measured in days — determines how much working capital a business needs. You can calculate it using three components:
Cash Conversion Cycle (CCC) = Days Inventory Outstanding (DIO) + Days Sales Outstanding (DSO) − Days Payable Outstanding (DPO)
- Days Inventory Outstanding (DIO): On average, how many days does it take to sell your inventory? A lower number means stock moves faster.
- Days Sales Outstanding (DSO): On average, how many days after invoicing do your customers pay? A lower number means you collect cash faster.
- Days Payable Outstanding (DPO): On average, how many days do you take to pay your suppliers? A higher number means you hold cash longer before paying out.
A business with a 25-day cycle needs far less working capital than one with an 80-day cycle selling identical volumes. Shortening the cycle — by selling faster, collecting sooner, and paying suppliers a little later — is the core discipline of working capital management.
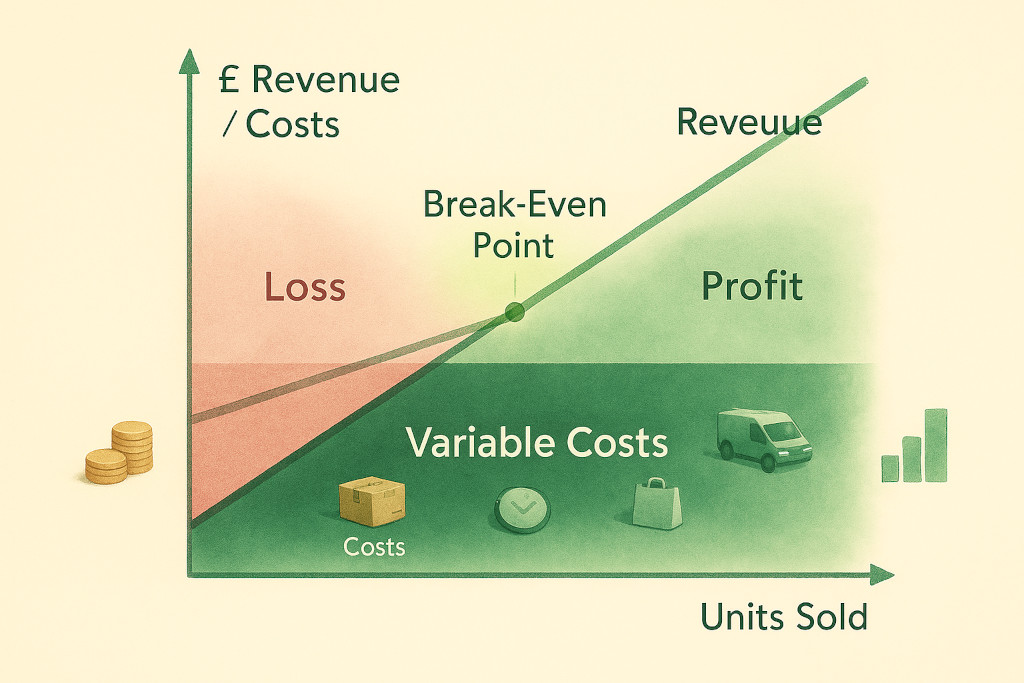
“Turnover is vanity, profit is sanity, but cash flow is reality.” This well-worn phrase captures precisely why working capital management matters. You can post a profit in your income statement while simultaneously running out of cash — if your receivables are slow and your inventory is stuck.
Key Working Capital Ratios Every SME Should Track
Three ratios give you an at-a-glance view of your working capital health. If you are already familiar with financial ratios from our earlier guide on liquidity, profitability, and efficiency ratios, you will recognise these as part of the liquidity family.
1. Current Ratio
Current Ratio = Current Assets ÷ Current Liabilities
A ratio above 1.0 means you have more short-term assets than liabilities. A ratio between 1.5 and 2.0 is generally considered healthy for most SMEs. Below 1.0 is a warning sign; above 3.0 may suggest you are holding too much idle cash or inventory.
2. Quick Ratio (Acid-Test Ratio)
Quick Ratio = (Current Assets − Inventory) ÷ Current Liabilities
The quick ratio strips out inventory because it may not convert to cash quickly (especially if stock is slow-moving). A ratio of 1.0 or above is generally considered sound. This is a more conservative and sometimes more informative test than the current ratio.
3. Cash Conversion Cycle (CCC)
CCC = DIO + DSO − DPO
As outlined above, the CCC measures how many days it takes to convert your operational investments back into cash. Industry benchmarks vary widely — a software business might have a CCC of 20–30 days, while a manufacturer might run at 60–90 days — so compare your figure to your own trend over time as well as to sector norms.
Strategies to Improve Your Working Capital

Once you understand your working capital position, you can take practical steps to strengthen it. Most improvements fall into one of three areas: accelerating inflows, managing outflows, and reducing the time cash is tied up in operations.
Accelerate your receivables. Send invoices immediately upon delivery — not at the end of the week or month. Make your payment terms clear on every invoice, and follow up on overdue accounts promptly and consistently. Consider offering a small early payment discount (for example, 1–2%) to customers who pay within 7 or 10 days. Our full guide to managing accounts receivable and accounts payable covers these tactics in detail.
Manage payables strategically. Negotiate longer payment terms with suppliers where possible — moving from 30-day to 45-day or 60-day terms can meaningfully extend the cash you hold. However, be careful not to strain supplier relationships or miss early-payment discounts that are more valuable than the cash benefit of delayed payment.
Optimise your inventory. Overstocking ties up cash in goods sitting on shelves. Review slow-moving lines regularly. Consider just-in-time ordering arrangements with reliable suppliers to reduce the average time inventory sits in your business before being sold.
Use cash flow forecasting. A 13-week rolling cash flow forecast will reveal working capital pressure points before they become crises, giving you time to act — whether that is chasing a large receivable, drawing on a credit facility, or delaying a discretionary spend. Our step-by-step guide to cash flow forecasting for SMEs walks through how to build one.
Review your pricing and credit terms together. If you offer 60-day payment terms to customers but only have 30-day terms from your suppliers, you are effectively financing your customers’ business. Shorter standard payment terms — or requiring deposits on large orders — can transform your working capital position.
The Working Capital Trap: Why Growth Can Hurt Cash Flow
One of the most counter-intuitive aspects of working capital is that rapid revenue growth can actually worsen your cash position in the short term. When sales accelerate, you often need to buy more inventory, take on more staff, and fulfil more orders — all before you collect the additional revenue. This “overtrading” or growth trap is one of the most common reasons that fast-growing SMEs encounter cash crises despite strong trading performance.
The antidote is to plan your working capital requirements as part of your annual budget and financial forecasting cycle. If you project that revenue will grow by 30% next year, model what that means for your receivables balance, your inventory requirements, and your supplier payment obligations — and ensure you have sufficient working capital (or available credit facilities) to fund the growth gap. Our guide to budgeting and forecasting for SMEs explains how to integrate these projections into your planning process.
For businesses operating across multiple entities — holding companies with subsidiaries, or franchise groups — working capital management adds another layer of complexity. Intercompany loans, different payment cycles across entities, and the need to monitor group-wide liquidity rather than just entity-level positions all require a coordinated approach. BrizoConsol’s guide on Group KPI Reporting for Multi-Entity Businesses covers how finance teams track working capital and liquidity metrics across a consolidated group.
Key Takeaways
- Working capital is current assets minus current liabilities. A positive figure means your business can meet its short-term obligations; a negative figure is a warning sign regardless of profitability.
- The cash conversion cycle (DIO + DSO − DPO) measures how quickly your business turns operational activity back into cash. Shorter is better.
- The current ratio and quick ratio give you an at-a-glance measure of working capital health. Aim for a current ratio between 1.5 and 2.0, and a quick ratio above 1.0.
- Practical improvements include invoicing faster, offering early payment incentives, negotiating longer supplier terms, and reducing inventory days.
- Rapid revenue growth can strain working capital. Always model working capital requirements as part of your growth planning — not as an afterthought.
- A 13-week rolling cash flow forecast is one of the most effective tools for anticipating and managing working capital pressure points.
Related reading: If you found this guide useful, you might also enjoy our posts on managing accounts receivable and accounts payable, understanding financial ratios for your business, cash flow forecasting for SMEs, and budgeting and forecasting for your financial year.