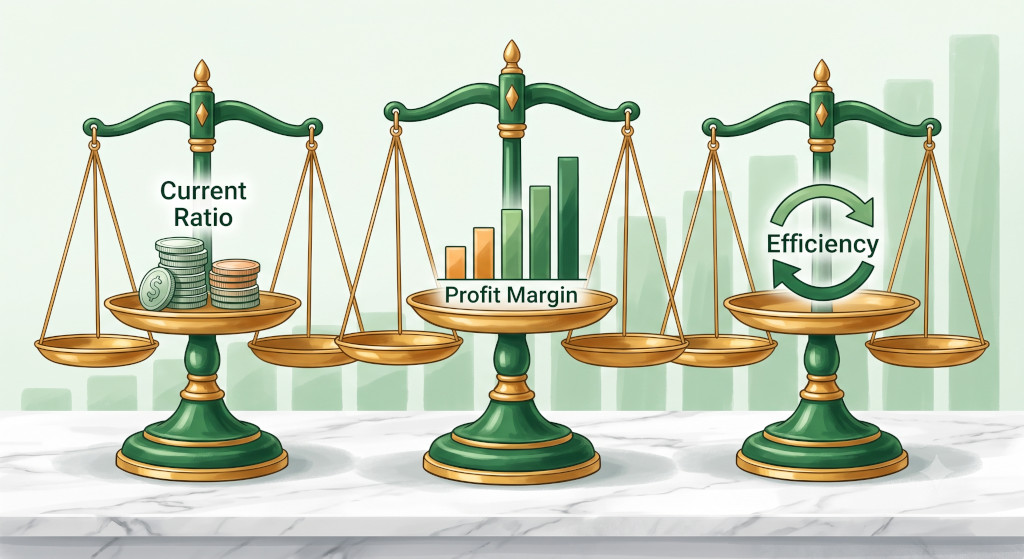
Your profit and loss account tells you whether you made money. Your balance sheet tells you what you own and what you owe. But neither number on its own tells you whether your business is healthy. That is what financial ratios are for. By expressing two related figures as a ratio or percentage, they strip away the noise of business size and let you see — clearly and quickly — how your company is performing on liquidity, profitability, and operational efficiency. Once you understand them, you will never look at a set of accounts the same way again.
What Are Financial Ratios and Why Do They Matter?
A financial ratio is simply one number expressed in relation to another. Dividing your current assets by your current liabilities gives you the current ratio. Dividing your net profit by your revenue gives you your net profit margin. Neither calculation is complicated, but the insight each delivers — about whether you can meet your short-term debts, or whether your pricing is generating real returns — is genuinely powerful.
Ratios matter because raw figures can be misleading. A company reporting £2 million in profit sounds successful. But if its revenue is £40 million, the net margin is only 5% — thin by almost any industry standard. Compare that to a £500,000-revenue business with £100,000 net profit, and a 20% margin tells a very different story about commercial efficiency.
For SME owners, ratios serve three practical purposes: they help you benchmark your own performance over time, they let you compare your business to industry norms, and they flag early warning signs before a minor problem becomes a crisis. Most lenders, investors, and accountants will look at a handful of key ratios when assessing your business — so it pays to understand what they are seeing.
Key insight: Financial ratios do not replace your accounts — they unlock them. A single ratio in isolation tells you little. The real value comes from tracking the same ratio across multiple periods, or comparing it against an industry benchmark, to understand the direction of travel.
Liquidity Ratios: Can Your Business Pay Its Bills?

Liquidity ratios measure your ability to meet short-term financial obligations. They answer one fundamental question: if your creditors wanted their money today, could you pay them?
Current Ratio
The current ratio divides your current assets (cash, stock, debtors) by your current liabilities (short-term creditors, tax due, bank overdrafts).
Formula: Current Ratio = Current Assets ÷ Current Liabilities
A ratio above 1.0 means you have more short-term assets than short-term debts — generally a healthy position. Most analysts look for a current ratio between 1.5 and 2.0 for manufacturing and retail businesses, though the ideal varies by industry. A ratio below 1.0 means you may struggle to meet short-term obligations, which is a red flag worth investigating urgently.
Quick Ratio (Acid Test)
The quick ratio is a stricter version that removes stock from the calculation. Stock can take time to convert to cash, so the acid test reveals whether you can cover short-term debts with liquid assets alone.
Formula: Quick Ratio = (Current Assets − Stock) ÷ Current Liabilities
A quick ratio above 1.0 is generally considered strong. If your current ratio looks healthy but your quick ratio is weak, it often signals that too much capital is tied up in stock — a working capital issue worth addressing. For more on how to manage this balance, see our guide to working capital management.
Profitability Ratios: Is Your Business Generating Real Returns?

Profitability ratios measure how effectively your business converts revenue and assets into profit. They are the ratios most closely watched by investors and lenders, and the ones that most directly reflect the strength of your pricing, cost control, and overall business model.
Gross Profit Margin
Gross profit margin measures the percentage of revenue remaining after deducting the direct cost of producing your goods or services (Cost of Goods Sold, or COGS). It reveals how efficiently you are producing and pricing.
Formula: Gross Profit Margin = (Revenue − COGS) ÷ Revenue × 100
A higher gross margin gives you more headroom to cover overheads and generate net profit. Trends matter: a falling gross margin over time may indicate rising input costs, supplier price increases, or pricing pressure from competitors. For a deeper look at COGS, see our post on Cost of Goods Sold explained.
Net Profit Margin
Net profit margin takes the full picture into account — revenue minus all costs, including overheads, depreciation, interest, and tax.
Formula: Net Profit Margin = Net Profit After Tax ÷ Revenue × 100
This is the bottom-line measure of commercial efficiency. A business with a strong gross margin but a weak net margin is likely carrying excessive overheads or high debt-service costs. Tracking this ratio alongside gross margin helps pinpoint exactly where value is being lost.
Return on Assets (ROA)
Return on assets measures how efficiently your business uses its asset base to generate profit. It is particularly useful for asset-heavy businesses such as manufacturers, retailers with large stock holdings, or businesses with significant property.
Formula: ROA = Net Profit ÷ Total Assets × 100
Return on Equity (ROE)
Return on equity measures the return generated for every pound of shareholder equity invested in the business. It is the ratio most commonly used by investors to assess whether a business is generating adequate returns on their capital.
Formula: ROE = Net Profit ÷ Shareholders’ Equity × 100
For groups with associate companies or joint ventures, ROE analysis can become more nuanced — since profits from associates flow through the equity method rather than as revenue. BrizoConsol’s guide on equity method accounting in group consolidation explains how these arrangements affect a group’s reported earnings and equity.
Efficiency Ratios: How Well Are You Managing Your Resources?
Efficiency ratios — sometimes called activity ratios — measure how effectively your business manages its assets and liabilities to generate revenue. They are particularly important for businesses with significant stock, debtor, or creditor balances, and tie directly to cash flow performance.
Debtor Days (Days Sales Outstanding)
Debtor days measures the average number of days it takes your customers to pay you. A high debtor days figure means cash is sitting with customers rather than in your account — a common cause of cash flow problems even in profitable businesses.
Formula: Debtor Days = (Trade Debtors ÷ Revenue) × 365
If your payment terms are 30 days but your debtor days ratio is 55, you have a collections problem worth addressing. See our guide on accounts receivable and accounts payable for practical steps to tighten your collections process.
Creditor Days
Creditor days measures the average time you take to pay your suppliers. Unlike debtor days, a higher number is not necessarily bad — extended supplier credit is a legitimate source of working capital. However, if your creditor days creep beyond agreed payment terms, you risk damaging supplier relationships and your credit rating.
Formula: Creditor Days = (Trade Creditors ÷ COGS) × 365
Inventory Turnover
Inventory turnover measures how many times your stock is sold and replaced in a given period. A higher turnover generally indicates efficient stock management and strong demand; a low turnover may signal obsolete stock or over-purchasing.
Formula: Inventory Turnover = COGS ÷ Average Inventory
Worked Example: Ratio Analysis for a Hypothetical SME
Consider a small manufacturing business — let us call it GreenMake Ltd — with the following figures for the year ended 31 March 2026:
| Item | Amount (£) |
|---|---|
| Revenue | 1,200,000 |
| Cost of Goods Sold (COGS) | 720,000 |
| Gross Profit | 480,000 |
| Net Profit After Tax | 96,000 |
| Current Assets | 350,000 |
| Stock (included in Current Assets) | 90,000 |
| Current Liabilities | 200,000 |
| Total Assets | 800,000 |
| Shareholders’ Equity | 450,000 |
| Trade Debtors | 180,000 |
| Trade Creditors | 95,000 |
Applying the formulas above:
| Ratio | Calculation | Result | Interpretation |
|---|---|---|---|
| Current Ratio | 350,000 ÷ 200,000 | 1.75 | Healthy — comfortably above 1.0 |
| Quick Ratio | (350,000 − 90,000) ÷ 200,000 | 1.30 | Solid liquidity even without stock |
| Gross Profit Margin | 480,000 ÷ 1,200,000 × 100 | 40% | Strong for manufacturing |
| Net Profit Margin | 96,000 ÷ 1,200,000 × 100 | 8% | Moderate — overheads are significant |
| Return on Assets | 96,000 ÷ 800,000 × 100 | 12% | Reasonable asset utilisation |
| Return on Equity | 96,000 ÷ 450,000 × 100 | 21.3% | Strong return for shareholders |
| Debtor Days | (180,000 ÷ 1,200,000) × 365 | 54.8 days | High — review collections process |
| Creditor Days | (95,000 ÷ 720,000) × 365 | 48.2 days | Reasonable — within normal terms |
The picture that emerges is mostly positive — GreenMake has healthy liquidity, a strong gross margin, and good shareholder returns. However, debtor days of nearly 55 days is the key concern: if the business is on 30-day terms with customers, almost a month’s revenue is sitting uncollected. Tightening collections alone could significantly improve the cash position.
Using Ratios as Part of Your Management Reporting Routine
Calculating ratios once is useful. Calculating them every month and tracking the trend over time is where the real value lies. Building a simple ratio dashboard into your monthly management accounts — alongside your profit and loss and balance sheet — gives you an early-warning system that flags issues before they escalate.
For SMEs producing monthly management accounts, it is worth tracking at minimum: gross margin (to spot cost or pricing shifts), debtor days (to protect cash flow), and the current ratio (to monitor solvency risk). If any of these ratios moves unexpectedly in a single month, that is your signal to investigate before the quarter-end arrives.
For a broader view of how to build financial performance tracking into your business, our guide to understanding the income statement and our post on essential KPIs for finance teams provide complementary frameworks for monitoring business performance.
Key Takeaways
- Financial ratios translate raw numbers into meaningful insight by expressing two related figures in proportion. They reveal liquidity, profitability, and efficiency in ways that standalone account balances cannot.
- Liquidity ratios (current ratio, quick ratio) tell you whether your business can meet its short-term obligations. A current ratio above 1.5 is generally healthy; a quick ratio below 1.0 warrants investigation.
- Profitability ratios (gross margin, net margin, ROA, ROE) show how effectively you convert revenue and assets into profit. Track gross and net margin together to pinpoint where value is leaking.
- Efficiency ratios (debtor days, creditor days, inventory turnover) reveal how well you manage working capital. High debtor days is one of the most common causes of cash flow problems in otherwise profitable SMEs.
- Ratios are most powerful when tracked over time. A single data point tells you where you are; a trend tells you where you are heading.
- Industry benchmarks matter. A 40% gross margin is excellent in manufacturing but thin in software. Always compare against sector norms as well as your own prior periods.
Related reading: For the underlying figures that feed into ratio analysis, see our guides on the balance sheet, the income statement, and working capital management. If you are building these ratios from management accounts, our post on management accounts vs statutory accounts explains which set of figures to use and why.