Tag: income statement

  • Cost of Goods Sold (COGS) Explained: What It Is, How to Calculate It, and Why It Matters

    Cost of Goods Sold (COGS) Explained: What It Is, How to Calculate It, and Why It Matters

    If your business sells a physical product — or buys in goods to resell — then Cost of Goods Sold is one of the most important numbers on your income statement. It represents the direct cost of producing or acquiring the goods your business actually sold during a period. Get it right and you have a clear view of how efficiently your business converts purchases into revenue. Get it wrong and every margin calculation, every pricing decision, and every profitability report you produce is built on sand. This guide explains exactly what COGS is, how to calculate it, how it sits within the P&L, and how to use it to make sharper business decisions.

    What Is Cost of Goods Sold?

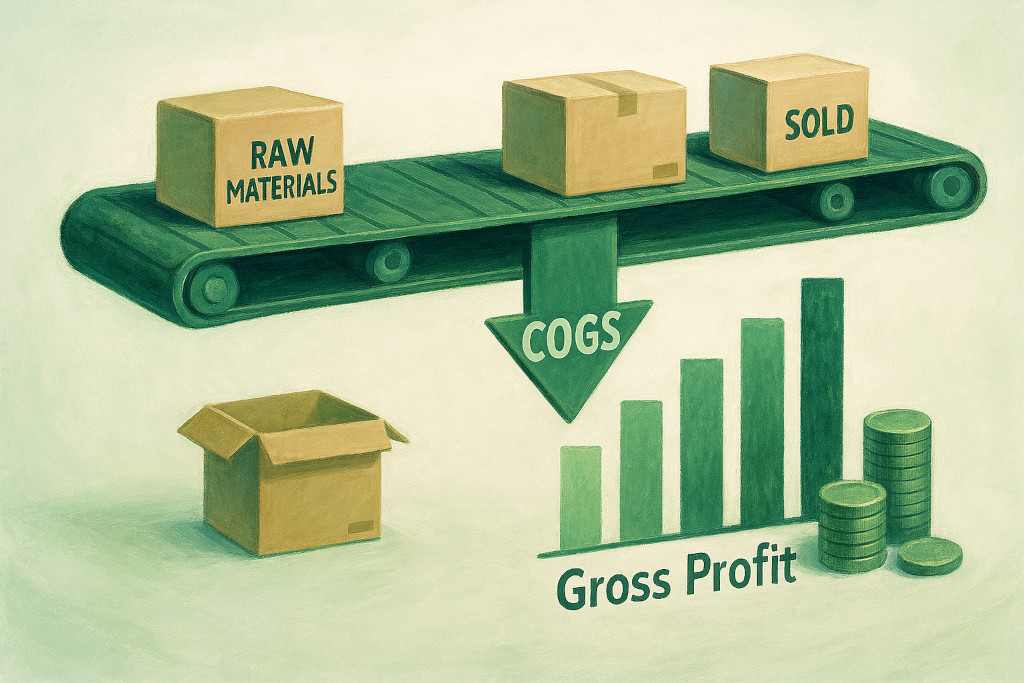
    Cost of Goods Sold — sometimes called Cost of Sales (COS) — is the total direct cost incurred to produce or purchase the goods that a business sold during a specific accounting period. It sits on the income statement directly below revenue, and subtracting it from revenue gives you gross profit.

    The word “direct” is important here. COGS includes only the costs that can be traced directly to the production or purchase of the goods sold. It does not include indirect overheads such as rent, marketing, or the salaries of your finance team — those sit further down the P&L as operating expenses.

    What counts as a direct cost depends on your business model:

    Business TypeTypical COGS Components
    Retailer / WholesalerPurchase price of goods, import duties, freight-in costs
    ManufacturerRaw materials, direct labour, factory overhead (machine depreciation, factory rent)
    Food & BeverageIngredients, packaging, direct kitchen labour
    Software / SaaSHosting costs, payment processing fees, third-party licences consumed per customer
    Service BusinessCOGS may not apply, or may include direct staff costs billed to projects

    Pure service businesses — accountants, consultants, lawyers — typically do not have COGS in the traditional sense. Their “cost of delivering the service” is often captured separately as cost of revenue or direct staff costs, though the label varies by convention and industry.

    How to Calculate COGS: The Opening Stock Formula

    For businesses that hold physical inventory, COGS is calculated using the opening stock formula:

    COGS = Opening Stock + Purchases During the Period − Closing Stock

    This formula works because it captures precisely the cost of goods that left your warehouse as sales — not the cost of everything you bought, and not the cost of what you still hold.

    Let us put numbers on it. Suppose Oakfield Trading Ltd has the following inventory position for the year ended 31 March 2026:

    ItemAmount (£)
    Opening stock (1 April 2025)48,000
    Purchases during the year312,000
    Closing stock (31 March 2026)(55,000)
    Cost of Goods Sold305,000

    Oakfield had £48,000 of stock at the start of the year, bought £312,000 of goods, but still held £55,000 at year end. The remaining £305,000 represents the cost of goods that were actually sold — and that is what appears on the income statement.

    Inventory Valuation Methods

    To calculate closing stock — and therefore COGS — you need a method for valuing the inventory you still hold. The three most common approaches are:

    • FIFO (First In, First Out): Assumes the oldest stock is sold first. In a rising-price environment, this produces a lower COGS and higher gross profit, as earlier (cheaper) costs are matched against revenue first.
    • AVCO (Average Cost): Uses a weighted average of all units available. Smooths out price fluctuations and is widely used for commodities and similar goods.
    • LIFO (Last In, First Out): Assumes the newest stock is sold first. Produces higher COGS in rising markets. Note that LIFO is not permitted under IFRS and is therefore rarely used in the UK, Australia, or most jurisdictions that follow international standards — though it remains permitted under US GAAP.

    The method you choose has a direct effect on both your reported profit and your balance sheet inventory value. It is important to apply the same method consistently from one period to the next, changing it only when there is a genuine and disclosed reason to do so.

    Gross Profit Margin: What COGS Tells You About Your Business

    Once you have COGS, you can calculate the two most important profitability metrics on the income statement: gross profit and gross profit margin.

    MetricFormulaOakfield Example
    Gross ProfitRevenue − COGS£500,000 − £305,000 = £195,000
    Gross Profit Margin(Gross Profit ÷ Revenue) × 100(£195,000 ÷ £500,000) × 100 = 39%

    A 39% gross margin means that for every £1 of revenue, Oakfield retains 39p before paying any of its operating costs (rent, salaries, marketing, and so on). The remaining 61p goes directly to fund the cost of the goods sold.

    Gross margin is one of the most powerful benchmarking metrics available. Tracking it over time immediately signals whether your pricing or purchasing is drifting — a falling gross margin can mean suppliers have increased their prices and you have not passed them on, or that product mix is shifting towards lower-margin lines. The ARD guide on key financial ratios covers gross margin alongside the full suite of profitability, liquidity, and efficiency metrics.

    COGS on the Income Statement

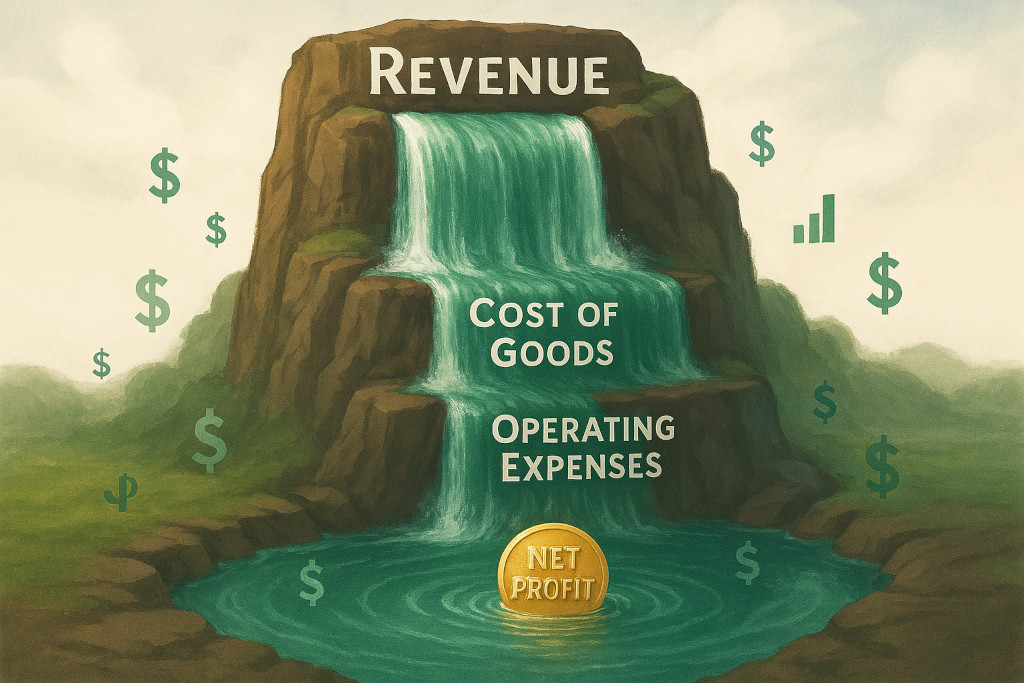
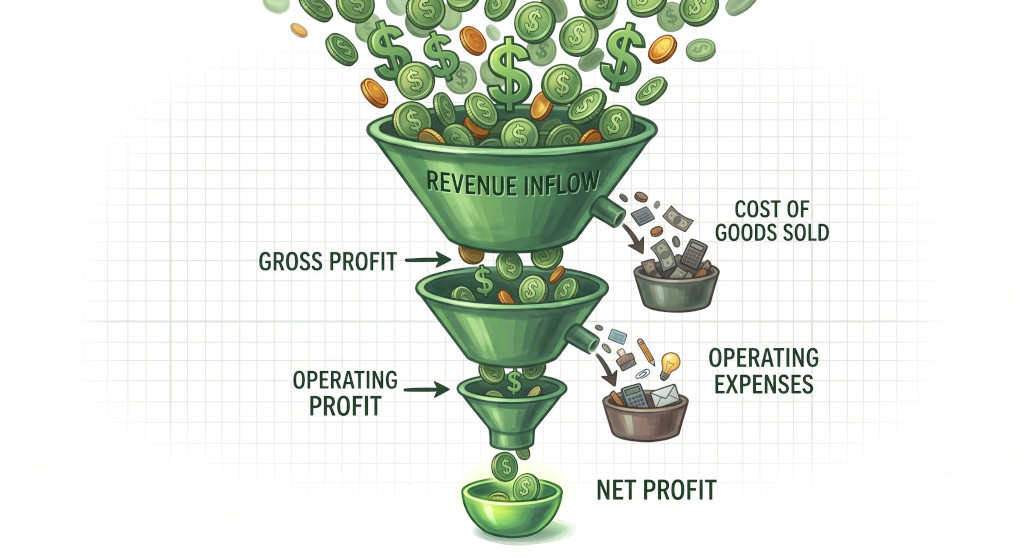
    Understanding where COGS sits within the P&L helps you read financial statements with much greater clarity. A standard SME income statement flows as follows:

    Line£
    Revenue (Turnover)500,000
    Less: Cost of Goods Sold(305,000)
    Gross Profit195,000
    Less: Operating Expenses (rent, salaries, marketing, etc.)(140,000)
    Operating Profit (EBIT)55,000
    Less: Interest & tax(12,000)
    Net Profit43,000

    COGS is the first deduction from revenue and therefore sets the ceiling for everything that follows. A business with a structurally high COGS relative to revenue will always struggle to reach a healthy net profit, no matter how tightly it controls overhead. This is why pricing strategy, supplier negotiation, and production efficiency all ultimately show up in this one line. For a deeper walkthrough of the full P&L structure, the ARD guide to understanding the income statement covers each section in detail.

    Gross margin is not just a reporting metric — it is a business health signal. If your gross margin is shrinking quarter by quarter and you have not changed your pricing, something in your cost base is moving against you. COGS is where you find out what.

    Finance teams working across multiple entities — for example, a group where one subsidiary manufactures goods and sells them to a sibling trading company — need to be careful that intercompany sales do not inflate both revenue and COGS at the group level. BrizoConsol’s guide to the practical use of financial reporting for SMEs discusses how meaningful reporting requires eliminating this kind of internal noise to produce accounts that reflect genuine external activity.

    Common COGS Mistakes to Avoid

    Even experienced business owners make consistent errors when it comes to COGS. These are the most frequent:

    • Including overhead costs in COGS. Rent, utilities, and management salaries belong below the gross profit line as operating expenses — not in COGS — unless they are directly and exclusively tied to production (e.g. a factory-floor manager’s salary vs. the CEO’s salary).
    • Forgetting freight-in. The cost of getting goods to your warehouse (inbound shipping, import duties) is part of the cost of acquiring those goods and belongs in COGS. Outbound shipping to customers is typically an operating expense.
    • Not adjusting for stock write-offs. If goods are damaged, expired, or obsolete, the write-off should flow through COGS or as a separate line near it — not be quietly ignored. Overstating closing stock understates COGS and overstates profit.
    • Mixing up cash paid vs. cost of goods sold. The cash you paid to suppliers this period is not the same as COGS for this period. If you bought £100,000 of stock but only sold goods with a cost of £70,000, your COGS is £70,000 — the other £30,000 is an asset (closing stock) on the balance sheet.
    • Inconsistent inventory counts. COGS depends on an accurate closing stock figure. Without a reliable stock count or perpetual inventory system, your gross margin figures are unreliable and comparisons between periods are meaningless.

    Key Takeaways

    • Cost of Goods Sold (COGS) is the direct cost of producing or purchasing the goods a business actually sold during a period.
    • The formula is: Opening Stock + Purchases − Closing Stock = COGS.
    • COGS sits immediately below revenue on the income statement; Revenue minus COGS equals Gross Profit.
    • Gross profit margin (Gross Profit ÷ Revenue) is one of the most important indicators of business pricing strength and cost efficiency.
    • Inventory valuation method (FIFO, AVCO, or LIFO) affects both COGS and the balance sheet stock figure — apply it consistently.
    • Common errors include including overhead in COGS, forgetting freight-in, and failing to write off obsolete stock.

    Related Reading

    COGS is one piece of a larger picture. To see how it fits into the full income statement, read the ARD guide to understanding the income statement. To understand how gross margin compares to other key ratios, the key financial ratios guide puts profitability metrics in context alongside liquidity and efficiency measures. And because COGS affects the balance sheet through inventory valuation, our guide to the balance sheet explains exactly where closing stock sits and how it is presented.

  • Understanding the Income Statement: A Complete Guide to Profit & Loss for SMEs

    Understanding the Income Statement: A Complete Guide to Profit & Loss for SMEs

    If you have ever stared at your bank balance thinking the business is doing fine, only to discover at year end that you barely broke even, you already understand why the income statement matters. The Profit & Loss report — more formally the income statement — is the financial document that tells you, with unambiguous clarity, whether your business made or lost money over a given period. It is one of the three core financial statements every business produces, alongside the balance sheet and the cash flow statement, and for most SME owners it is the most immediately useful of the three.

    What Is an Income Statement (Profit & Loss)?

    The income statement — also called the Profit & Loss report, or simply the P&L — is a summary of a company’s revenues and expenses over a specific period, typically a month, a quarter, or a financial year. The end result is either a net profit (income exceeded expenses) or a net loss (expenses exceeded income).

    Unlike the balance sheet, which captures the financial position of a business at a single point in time, the income statement covers a period of time. Think of it this way: the balance sheet is a photograph; the income statement is a film reel. One shows you where things stand today; the other shows you how you got there.

    For SME owners, the income statement answers the most pressing operational question: are we profitable? It also underpins decisions about pricing, hiring, cost control, and investment — which is why understanding how to read one is an essential skill, not just an accountant’s concern.

    The Structure of an Income Statement

    Most income statements follow the same top-to-bottom structure, moving from total revenue down through layers of deductions until a final profit figure is reached. Each layer has a specific name and meaning.

    Revenue (Turnover)

    Revenue is the total income your business generated from its core trading activities — selling goods, providing services, or both. This is sometimes called “turnover” or “sales”. It is recorded at the top of the statement and is often called the “top line”.

    Cost of Goods Sold (COGS) / Cost of Sales

    Directly beneath revenue sits the cost of producing what you sold. For a product-based business, this is raw materials, manufacturing costs, and direct labour. For a service business, it might be the direct cost of delivering a project. Subtracting COGS from Revenue gives you Gross Profit.

    Gross Profit and Gross Margin

    Gross profit shows how efficiently you convert revenue into profit before you account for overhead. Gross margin — expressed as a percentage — is one of the most watched metrics in any business:

    Gross Margin % = (Gross Profit ÷ Revenue) × 100

    Operating Expenses

    Also called overheads, these are costs that keep the business running but are not directly tied to producing individual units of revenue. Rent, salaries, marketing, software subscriptions, and utilities are common examples. Subtracting these from Gross Profit gives you Operating Profit (also called EBIT — Earnings Before Interest and Tax).

    Interest and Tax

    Below operating profit, you deduct interest on any debt the business carries, and then corporation tax (or income tax in a sole trader context). The result is Net Profit — the much-discussed “bottom line”.

    Line ItemExample (£)What It Tells You
    Revenue500,000Total sales generated in the period
    Cost of Goods Sold(200,000)Direct cost of products/services sold
    Gross Profit300,000Profit before overheads (60% gross margin)
    Operating Expenses(180,000)Salaries, rent, marketing, admin
    Operating Profit (EBIT)120,000Profit from trading before interest & tax
    Interest Expense(10,000)Cost of business borrowing
    Tax(27,500)Corporation tax at 25%
    Net Profit82,500What the business ultimately earned

    The income statement does not tell you how much cash the business has in the bank — it tells you how much value it created. A business can be highly profitable on paper yet still run out of cash. That is why the P&L and the cash flow statement must always be read together.

    Income Statement vs Balance Sheet: What’s the Difference?

    One of the most common sources of confusion for new business owners is the relationship between the income statement and the balance sheet. They report different things and serve different purposes, but they are deeply connected.

    The balance sheet shows what your business owns (assets) and owes (liabilities) at a specific date, with the difference being equity. The income statement shows what your business earned and spent over a period of time. The connection between them is this: the net profit from the income statement flows directly into retained earnings on the balance sheet, increasing owner’s equity.

    If the accounting equation — Assets = Liabilities + Equity — is new to you, the Accounting Equation Explained article on this site is an excellent starting point for understanding how the P&L feeds into the wider financial picture.

    For group companies with multiple subsidiaries, the picture becomes more complex: the income statement of each entity must be consolidated, and intra-group transactions — such as one subsidiary selling services to another — must be eliminated to avoid double-counting revenue. BrizoConsol’s guide on why intercompany transactions are eliminated in financial consolidation covers this in practical detail for anyone managing a multi-entity structure.

    How to Read and Analyse Your P&L

    Reading the bottom line is only the beginning. The real value of the income statement comes from tracking ratios and trends over time.

    Key ratios to watch

    • Gross Margin % — measures how efficiently you produce revenue. A falling gross margin over several periods suggests either rising costs or pricing pressure.
    • Operating Margin % — Operating Profit ÷ Revenue. Shows how well the business controls overheads relative to revenue.
    • Net Profit Margin % — Net Profit ÷ Revenue. The truest measure of overall profitability after all deductions.
    • Expense Ratios — individual overhead categories as a percentage of revenue (e.g. staff costs ÷ revenue). Useful for spotting where costs are creeping up.

    Comparative analysis

    A single month’s P&L in isolation tells you relatively little. The power comes from comparison: this month vs last month, this quarter vs the same quarter last year, or actual results vs budget. Most accounting software will produce a comparative P&L automatically — the habit of reviewing it regularly is what converts raw numbers into actionable decisions.

    When your income statement is looking healthy but cash is still tight, the issue usually lies in the timing of when money moves — receivables, payables, or stock. The cash flow statement guide on Accounting Reports Daily explains exactly how to reconcile the gap between profit and cash.

    Common Income Statement Mistakes SMEs Make

    Even with good accounting software, a few persistent errors can distort the picture your income statement is painting.

    1. Mixing capital and revenue expenditure. Buying a piece of equipment is not an operating expense — it is a capital asset. Recording it as an expense in the P&L overstates costs and understates profit in the period.
    2. Recording revenue too early. Under accruals accounting, revenue is recognised when it is earned — when goods are delivered or services rendered — not when cash is received. Recognising revenue early inflates profit in the wrong period.
    3. Ignoring accruals and prepayments. If you pay your annual insurance premium in January, only one-twelfth of that cost belongs in each month’s P&L. Failing to spread costs correctly creates lumpy, misleading results.
    4. Not reconciling to the bank. It is surprisingly easy for transactions to be miscoded, omitted, or duplicated. A monthly bank reconciliation catches errors before they compound.
    5. Reviewing only once a year. The income statement is most useful as a management tool when reviewed monthly. Annual reviews are too slow to catch problems while there is still time to act.

    For SMEs that operate across multiple entities or jurisdictions, there is a further complexity: ensuring that the chart of accounts — the taxonomy of every revenue and expense category — is consistently structured. BrizoConsol’s detailed guide on how to design a common chart of accounts for multi-entity groups is a practical resource for finance teams trying to produce comparable P&Ls across the group.


    Key Takeaways

    • The income statement (Profit & Loss report) summarises revenue, expenses, and profit over a specific period — it is a film reel, not a photograph.
    • It flows from Revenue → Gross Profit → Operating Profit → Net Profit, with each line revealing a different layer of performance.
    • Gross margin, operating margin, and net profit margin are the three ratios to track consistently over time.
    • The P&L connects to the balance sheet through retained earnings: net profit increases owner’s equity.
    • Profit on the income statement is not the same as cash in the bank — always read the P&L alongside the cash flow statement.
    • Common errors include mixing capital and revenue expenditure, recognising revenue too early, and failing to accrue costs correctly.
    • Monthly review, not annual, is what makes the income statement genuinely useful as a management tool.

    Related reading: For a deeper understanding of how the income statement sits within the full set of financial statements, see our guides on the Balance Sheet: Structure and Key ElementsUnderstanding the Cash Flow Statement, and Cash Flow Forecasting for SMEs.