Tag: cost of goods sold

  • Inventory Valuation Methods Explained: FIFO, LIFO, and AVCO for SMEs

    Inventory Valuation Methods Explained: FIFO, LIFO, and AVCO for SMEs

    If your business buys and sells physical goods, one question sits quietly at the centre of your accounts: when you sell a unit of stock, which cost do you use to calculate your profit? This might sound like a technicality, but the answer can produce materially different profit figures, different balance sheet values, and different tax bills — all from the same physical reality of goods bought and sold. The choice of inventory valuation method determines how you assign the cost of goods to the units you sell (reducing profit) versus the units still sitting in your warehouse (remaining on the balance sheet). Three methods dominate in practice: FIFO, LIFO, and AVCO. Understanding how each works — and which applies to your business — is essential for any SME that holds stock.

    Why Inventory Valuation Matters

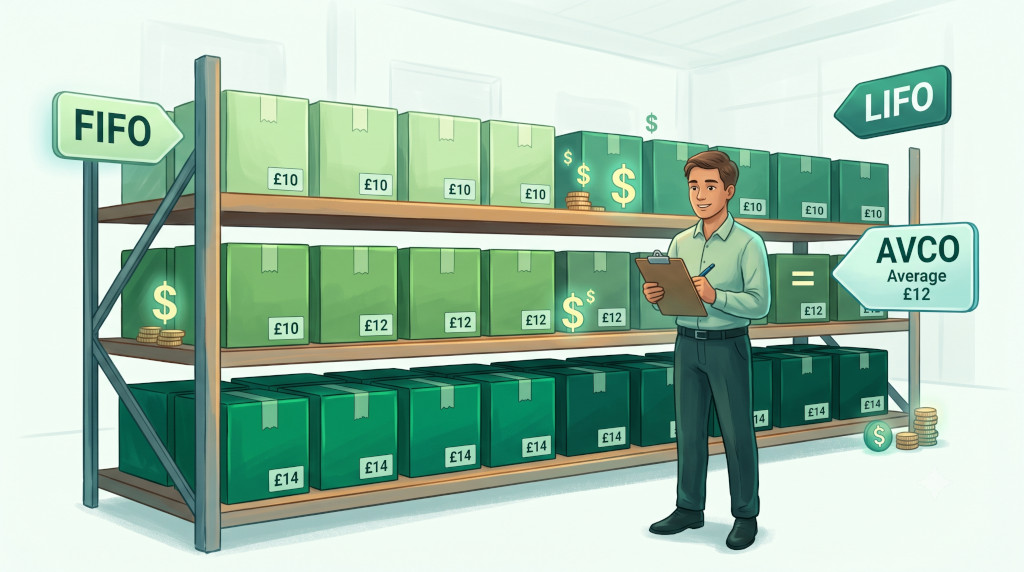
    Before exploring the three methods, it helps to be clear about what inventory valuation is actually doing. When you buy stock at different times, you often pay different prices. Supplier costs change, exchange rates fluctuate, and bulk discounts vary. At the end of any period, your warehouse might hold identical products that were purchased at £10, £12, and £14 per unit at different points in time.

    When you sell one of those units, which cost flows through to your Cost of Goods Sold (COGS) on the profit and loss account — and which remains as closing stock on your balance sheet? The inventory valuation method you choose answers this question. And because COGS directly drives gross profit, and closing stock directly affects the balance sheet and therefore equity, the choice of method is not neutral. In a period of rising prices, different methods produce genuinely different financial results from the same underlying transactions.

    You can read more about how COGS is calculated and why it matters in our guide to Cost of Goods Sold explained.

    FIFO: First In, First Out

    FIFO assumes that the oldest units of stock are sold first. The cost assigned to goods sold is the cost of the earliest purchases; the cost of the most recent purchases remains in closing stock.

    In physical terms, FIFO mirrors how most perishable goods businesses actually operate — a bakery sells yesterday’s bread before today’s, and a grocer rotates stock so the oldest items face the front. But as an accounting assumption, FIFO applies even when there is no physical rotation — it is purely about which cost flows out first.

    In a period of rising prices, FIFO produces a lower COGS (because cheaper older stock is expensed first) and a higher closing stock value (because more expensive recent purchases remain). The result is a higher gross profit. The balance sheet shows closing stock at the most current costs, making it a realistic reflection of what that stock would cost to replace.

    FIFO is permitted under both UK GAAP (FRS 102) and IFRS. For most product-based SMEs in the UK and internationally, it is the default method.

    LIFO: Last In, First Out

    LIFO assumes the opposite: the most recently purchased stock is sold first. The cost of the newest units flows through to COGS; the oldest (and typically cheapest, in a rising market) costs remain in closing stock.

    In a period of rising prices, LIFO produces a higher COGS and lower gross profit — because the most expensive recent purchases are expensed first. Closing stock is valued at older, cheaper prices, which means the balance sheet understates the current replacement cost of inventory.

    The US has historically permitted LIFO under US GAAP, and some US businesses have used it specifically because higher COGS in inflationary periods reduces taxable income. However, LIFO is prohibited under IFRS and under UK GAAP (FRS 102). If your business reports under IFRS or UK GAAP — as most UK companies do — LIFO is not an available option. It is worth understanding for completeness, particularly if you work with US-based groups or encounter it in comparative analysis.

    Key insight: Under IFRS and UK GAAP, the permitted inventory cost methods are FIFO and Weighted Average Cost (AVCO). LIFO is explicitly prohibited. Choosing between FIFO and AVCO is therefore the practical decision for most UK SMEs.

    AVCO: Weighted Average Cost

    AVCO (Weighted Average Cost, also called WAC or the average cost method) takes a different approach entirely. Rather than tracking which specific batch was sold first or last, it calculates a weighted average cost across all units in stock and applies that single average cost to every unit sold and every unit remaining.

    The weighted average is recalculated each time new stock is purchased:

    New Average Cost = (Value of Existing Stock + Cost of New Purchase) ÷ (Existing Units + New Units)

    Each sale then uses the current average cost to calculate COGS, and the remaining stock is carried at that same average. When the next purchase arrives, the average is recalculated again.

    AVCO smooths out price fluctuations. In a rising market, it produces a COGS and gross profit between what FIFO and LIFO would generate. It avoids the distortions of either extreme and is particularly suited to businesses with homogeneous, interchangeable stock where tracking individual batches is impractical.

    Worked Example: Kestrel Components

    Kestrel Components buys and sells an industrial fastener. During June, the following transactions occur:

    DateTransactionUnitsUnit CostTotal
    1 JunOpening stock100£10.00£1,000
    8 JunPurchase150£12.00£1,800
    15 JunSale180
    22 JunPurchase100£14.00£1,400
    28 JunSale100

    At month-end, 70 units remain in stock (100 + 150 − 180 + 100 − 100 = 70). The question is: what is the COGS for the 280 units sold, and what is the value of the 70 units remaining?

    Under FIFO

    First sale (180 units): use 100 units at £10.00 (all opening stock), then 80 units at £12.00. COGS = (100 × £10) + (80 × £12) = £1,000 + £960 = £1,960.

    Second sale (100 units): use the remaining 70 units at £12.00, then 30 units at £14.00. COGS = (70 × £12) + (30 × £14) = £840 + £420 = £1,260.

    Total COGS: £3,220. Closing stock: 40 units at £14.00 = £560.

    Under AVCO

    After the 8 June purchase: average cost = (£1,000 + £1,800) ÷ (100 + 150) = £2,800 ÷ 250 = £11.20 per unit.

    First sale (180 units): COGS = 180 × £11.20 = £2,016. Remaining: 70 units × £11.20 = £784.

    After the 22 June purchase: new average = (£784 + £1,400) ÷ (70 + 100) = £2,184 ÷ 170 = £12.85 per unit.

    Second sale (100 units): COGS = 100 × £12.85 = £1,285. Closing stock: 70 units × £12.85 = £899.50.

    Total COGS: £3,301.

    Side-by-Side Comparison

    MethodTotal COGSClosing Stock ValueGross Profit Impact
    FIFO£3,220£560Higher (lower COGS)
    AVCO£3,301£899.50Lower (higher COGS)
    LIFO (illustrative only — not permitted under IFRS/UK GAAP)£3,580£200Lowest (highest COGS)

    Note that the total cost of goods available for sale is the same under all three methods: £1,000 + £1,800 + £1,400 = £4,200. The difference is only in how that total is split between COGS and closing stock. COGS + Closing Stock always equals the total available — the method simply determines the allocation.

    Choosing the Right Method for Your Business

    For UK and IFRS-reporting businesses, the practical choice is between FIFO and AVCO. Here is how to think about it.

    FIFO is well suited to businesses where stock physically rotates — food, pharmaceuticals, perishables, time-sensitive goods. It produces a closing stock value closest to current replacement cost, making the balance sheet more meaningful to lenders and investors. In periods of rising prices, it reports higher profits — which can be an advantage for demonstrating financial performance but also means a higher tax liability.

    AVCO is well suited to businesses with homogeneous, interchangeable stock where individual batch tracking is impractical — bulk commodities, raw materials, components. It smooths volatility in reported profit caused by price fluctuations, which can make period-to-period comparisons more stable. It is also simpler to operate in a perpetual inventory system that recalculates the average with each purchase.

    The single most important rule is consistency: whichever method you choose must be applied consistently from period to period. Switching methods is permitted under accounting standards but requires disclosure and restatement of prior period comparatives — it is not a mechanism for managing reported profit in a given year. Any change must be justified as producing more reliable and relevant information, and the impact disclosed in the notes to the accounts.

    For businesses operating across multiple entities — where one subsidiary might historically have used FIFO and another AVCO — consolidating group accounts requires harmonising inventory policies. This is one of many accounting policy alignment challenges that multi-entity finance teams encounter at the group reporting level.


    Key Takeaways

    • Inventory valuation determines which purchase cost flows to COGS (reducing profit) and which remains in closing stock (on the balance sheet). The same physical stock can produce different profit figures depending on the method used.
    • FIFO (First In, First Out) assumes oldest stock is sold first. In rising prices, it produces lower COGS, higher gross profit, and closing stock valued at current prices.
    • LIFO (Last In, First Out) assumes newest stock is sold first. It is prohibited under IFRS and UK GAAP and should not be used by businesses reporting under these standards.
    • AVCO (Weighted Average Cost) calculates a running average cost and applies it to all sales. It smooths out price fluctuations and sits between FIFO and LIFO in profit impact.
    • COGS + Closing Stock always equals the total cost of goods available for sale — the method only determines how that total is allocated between the two.
    • Whichever method you choose must be applied consistently. Switching requires justification and disclosure — it cannot be used to manage reported profit.
    • UK SMEs reporting under FRS 102 or IFRS should use FIFO or AVCO. Confirm with your accountant which best fits your business’s stock characteristics and reporting needs.

    Related Reading

    Inventory valuation sits at the intersection of cost accounting, profit reporting, and balance sheet management. These ARD guides provide the context around it:

  • Cost of Goods Sold (COGS) Explained: What It Is, How to Calculate It, and Why It Matters

    Cost of Goods Sold (COGS) Explained: What It Is, How to Calculate It, and Why It Matters

    If your business sells a physical product — or buys in goods to resell — then Cost of Goods Sold is one of the most important numbers on your income statement. It represents the direct cost of producing or acquiring the goods your business actually sold during a period. Get it right and you have a clear view of how efficiently your business converts purchases into revenue. Get it wrong and every margin calculation, every pricing decision, and every profitability report you produce is built on sand. This guide explains exactly what COGS is, how to calculate it, how it sits within the P&L, and how to use it to make sharper business decisions.

    What Is Cost of Goods Sold?

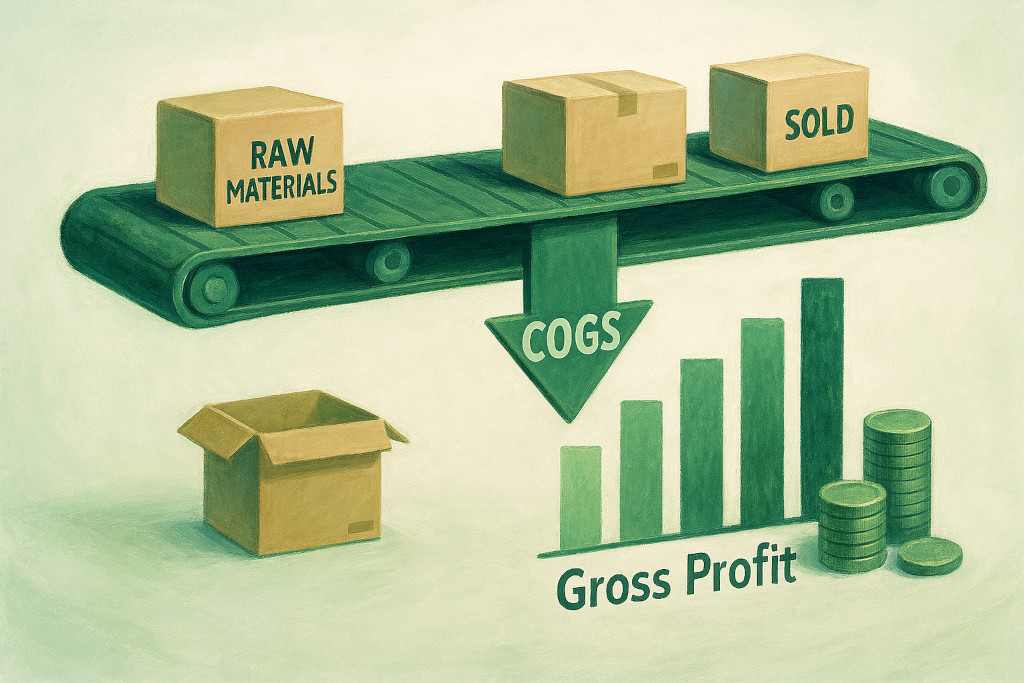
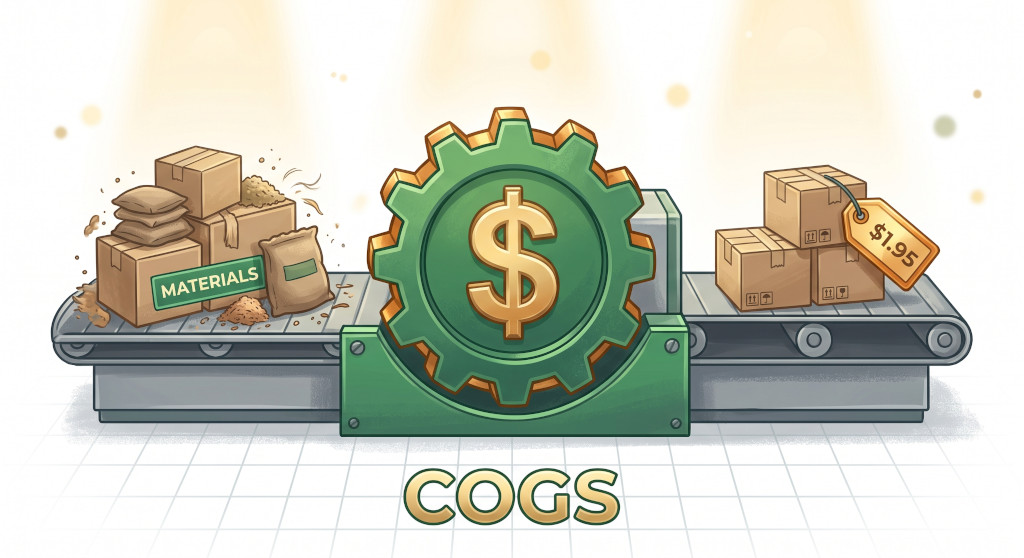
    Cost of Goods Sold — sometimes called Cost of Sales (COS) — is the total direct cost incurred to produce or purchase the goods that a business sold during a specific accounting period. It sits on the income statement directly below revenue, and subtracting it from revenue gives you gross profit.

    The word “direct” is important here. COGS includes only the costs that can be traced directly to the production or purchase of the goods sold. It does not include indirect overheads such as rent, marketing, or the salaries of your finance team — those sit further down the P&L as operating expenses.

    What counts as a direct cost depends on your business model:

    Business TypeTypical COGS Components
    Retailer / WholesalerPurchase price of goods, import duties, freight-in costs
    ManufacturerRaw materials, direct labour, factory overhead (machine depreciation, factory rent)
    Food & BeverageIngredients, packaging, direct kitchen labour
    Software / SaaSHosting costs, payment processing fees, third-party licences consumed per customer
    Service BusinessCOGS may not apply, or may include direct staff costs billed to projects

    Pure service businesses — accountants, consultants, lawyers — typically do not have COGS in the traditional sense. Their “cost of delivering the service” is often captured separately as cost of revenue or direct staff costs, though the label varies by convention and industry.

    How to Calculate COGS: The Opening Stock Formula

    For businesses that hold physical inventory, COGS is calculated using the opening stock formula:

    COGS = Opening Stock + Purchases During the Period − Closing Stock

    This formula works because it captures precisely the cost of goods that left your warehouse as sales — not the cost of everything you bought, and not the cost of what you still hold.

    Let us put numbers on it. Suppose Oakfield Trading Ltd has the following inventory position for the year ended 31 March 2026:

    ItemAmount (£)
    Opening stock (1 April 2025)48,000
    Purchases during the year312,000
    Closing stock (31 March 2026)(55,000)
    Cost of Goods Sold305,000

    Oakfield had £48,000 of stock at the start of the year, bought £312,000 of goods, but still held £55,000 at year end. The remaining £305,000 represents the cost of goods that were actually sold — and that is what appears on the income statement.

    Inventory Valuation Methods

    To calculate closing stock — and therefore COGS — you need a method for valuing the inventory you still hold. The three most common approaches are:

    • FIFO (First In, First Out): Assumes the oldest stock is sold first. In a rising-price environment, this produces a lower COGS and higher gross profit, as earlier (cheaper) costs are matched against revenue first.
    • AVCO (Average Cost): Uses a weighted average of all units available. Smooths out price fluctuations and is widely used for commodities and similar goods.
    • LIFO (Last In, First Out): Assumes the newest stock is sold first. Produces higher COGS in rising markets. Note that LIFO is not permitted under IFRS and is therefore rarely used in the UK, Australia, or most jurisdictions that follow international standards — though it remains permitted under US GAAP.

    The method you choose has a direct effect on both your reported profit and your balance sheet inventory value. It is important to apply the same method consistently from one period to the next, changing it only when there is a genuine and disclosed reason to do so.

    Gross Profit Margin: What COGS Tells You About Your Business

    Once you have COGS, you can calculate the two most important profitability metrics on the income statement: gross profit and gross profit margin.

    MetricFormulaOakfield Example
    Gross ProfitRevenue − COGS£500,000 − £305,000 = £195,000
    Gross Profit Margin(Gross Profit ÷ Revenue) × 100(£195,000 ÷ £500,000) × 100 = 39%

    A 39% gross margin means that for every £1 of revenue, Oakfield retains 39p before paying any of its operating costs (rent, salaries, marketing, and so on). The remaining 61p goes directly to fund the cost of the goods sold.

    Gross margin is one of the most powerful benchmarking metrics available. Tracking it over time immediately signals whether your pricing or purchasing is drifting — a falling gross margin can mean suppliers have increased their prices and you have not passed them on, or that product mix is shifting towards lower-margin lines. The ARD guide on key financial ratios covers gross margin alongside the full suite of profitability, liquidity, and efficiency metrics.

    COGS on the Income Statement

    Understanding where COGS sits within the P&L helps you read financial statements with much greater clarity. A standard SME income statement flows as follows:

    Line£
    Revenue (Turnover)500,000
    Less: Cost of Goods Sold(305,000)
    Gross Profit195,000
    Less: Operating Expenses (rent, salaries, marketing, etc.)(140,000)
    Operating Profit (EBIT)55,000
    Less: Interest & tax(12,000)
    Net Profit43,000

    COGS is the first deduction from revenue and therefore sets the ceiling for everything that follows. A business with a structurally high COGS relative to revenue will always struggle to reach a healthy net profit, no matter how tightly it controls overhead. This is why pricing strategy, supplier negotiation, and production efficiency all ultimately show up in this one line. For a deeper walkthrough of the full P&L structure, the ARD guide to understanding the income statement covers each section in detail.

    Gross margin is not just a reporting metric — it is a business health signal. If your gross margin is shrinking quarter by quarter and you have not changed your pricing, something in your cost base is moving against you. COGS is where you find out what.

    Finance teams working across multiple entities — for example, a group where one subsidiary manufactures goods and sells them to a sibling trading company — need to be careful that intercompany sales do not inflate both revenue and COGS at the group level. BrizoConsol’s guide to the practical use of financial reporting for SMEs discusses how meaningful reporting requires eliminating this kind of internal noise to produce accounts that reflect genuine external activity.

    Common COGS Mistakes to Avoid

    Even experienced business owners make consistent errors when it comes to COGS. These are the most frequent:

    • Including overhead costs in COGS. Rent, utilities, and management salaries belong below the gross profit line as operating expenses — not in COGS — unless they are directly and exclusively tied to production (e.g. a factory-floor manager’s salary vs. the CEO’s salary).
    • Forgetting freight-in. The cost of getting goods to your warehouse (inbound shipping, import duties) is part of the cost of acquiring those goods and belongs in COGS. Outbound shipping to customers is typically an operating expense.
    • Not adjusting for stock write-offs. If goods are damaged, expired, or obsolete, the write-off should flow through COGS or as a separate line near it — not be quietly ignored. Overstating closing stock understates COGS and overstates profit.
    • Mixing up cash paid vs. cost of goods sold. The cash you paid to suppliers this period is not the same as COGS for this period. If you bought £100,000 of stock but only sold goods with a cost of £70,000, your COGS is £70,000 — the other £30,000 is an asset (closing stock) on the balance sheet.
    • Inconsistent inventory counts. COGS depends on an accurate closing stock figure. Without a reliable stock count or perpetual inventory system, your gross margin figures are unreliable and comparisons between periods are meaningless.

    Key Takeaways

    • Cost of Goods Sold (COGS) is the direct cost of producing or purchasing the goods a business actually sold during a period.
    • The formula is: Opening Stock + Purchases − Closing Stock = COGS.
    • COGS sits immediately below revenue on the income statement; Revenue minus COGS equals Gross Profit.
    • Gross profit margin (Gross Profit ÷ Revenue) is one of the most important indicators of business pricing strength and cost efficiency.
    • Inventory valuation method (FIFO, AVCO, or LIFO) affects both COGS and the balance sheet stock figure — apply it consistently.
    • Common errors include including overhead in COGS, forgetting freight-in, and failing to write off obsolete stock.

    Related Reading

    COGS is one piece of a larger picture. To see how it fits into the full income statement, read the ARD guide to understanding the income statement. To understand how gross margin compares to other key ratios, the key financial ratios guide puts profitability metrics in context alongside liquidity and efficiency measures. And because COGS affects the balance sheet through inventory valuation, our guide to the balance sheet explains exactly where closing stock sits and how it is presented.