Tag: management accounting

  • Break-Even Analysis Explained: How to Find the Point Where Your Business Starts Making Money

    Break-Even Analysis Explained: How to Find the Point Where Your Business Starts Making Money

    Before a business makes its first pound of profit, it must first earn enough to cover every cost it has already committed to — the rent, the salaries, the insurance, the equipment repayments. The exact point at which revenue catches up with those costs and profit begins is called the break-even point. Knowing where that line sits is one of the most powerful pieces of intelligence any business owner or manager can have. It answers the question every entrepreneur asks in quieter moments: how much do we actually need to sell just to keep the lights on?

    What Is Break-Even Analysis?

    Break-even analysis is a management accounting technique that determines the level of sales at which total revenue equals total costs — producing neither a profit nor a loss. Below the break-even point, the business is making a loss; above it, the business is making a profit. The analysis is straightforward to perform, requires only basic cost information, and can inform a surprisingly wide range of business decisions from pricing to investment appraisal to hiring.

    Unlike financial accounting, which records what has already happened, break-even analysis is a forward-looking tool. It is most useful when evaluating a new product, a new location, a change in pricing, or the impact of a cost increase. The question it always answers is: given our cost structure, how much output do we need to cover our costs?

    The Three Ingredients: Fixed Costs, Variable Costs, and Contribution Margin

    Break-even analysis rests on a clear separation of costs into two categories.

    Fixed Costs

    Fixed costs are costs that remain constant regardless of how much the business produces or sells. Rent, business rates, insurance premiums, salaried staff, loan repayments, and software subscriptions are all fixed costs. Whether you sell 100 units or 1,000 units this month, your rent does not change. These costs must be covered before any profit is earned.

    Variable Costs

    Variable costs change in direct proportion to output. The raw materials used to make a product, the packaging, the delivery cost, the sales commission — these all rise as production rises and fall when it falls. A useful test: if you produced zero units, would this cost be zero? If yes, it is variable.

    Some costs fall between the two — semi-variable costs like utilities or a part-time worker whose hours flex with demand. For break-even purposes, these are typically split into their fixed and variable components, or approximated as one or the other based on materiality.

    Contribution Margin

    The contribution margin is the amount each unit sold contributes towards covering fixed costs — and ultimately towards profit — after its own variable cost has been deducted.

    Contribution Margin per Unit = Selling Price per Unit − Variable Cost per Unit

    This is the engine of break-even analysis. The higher the contribution margin, the fewer units you need to sell to cover your fixed costs. A business with a high contribution margin reaches break-even faster than one that makes only a small margin on each unit.

    Calculating the Break-Even Point

    Once you have your fixed costs and contribution margin, the break-even point in units follows directly:

    Break-Even Point (Units) = Total Fixed Costs ÷ Contribution Margin per Unit

    To express break-even as a revenue figure rather than a unit count:

    Break-Even Revenue = Break-Even Units × Selling Price per Unit

    Alternatively, you can use the contribution margin ratio — the contribution margin expressed as a percentage of selling price — to go straight to a revenue figure:

    Break-Even Revenue = Total Fixed Costs ÷ Contribution Margin Ratio

    Worked Example: Harlow Candles Ltd

    Harlow Candles Ltd makes and sells scented candles. Here is their cost structure for a month:

    Cost ItemTypeAmount (£)
    Studio rentFixed1,200
    Equipment leaseFixed400
    Owner salaryFixed2,000
    Insurance & subscriptionsFixed150
    Total Monthly Fixed Costs3,750
    Wax, wick, fragrance, jar (per candle)Variable3.50
    Packaging & labelling (per candle)Variable0.75
    Postage/fulfilment (per candle)Variable1.25
    Total Variable Cost per Candle5.50
    Selling Price per Candle14.00

    Step 1 — Contribution Margin per unit:

    £14.00 − £5.50 = £8.50 per candle

    Step 2 — Break-Even Point in units:

    £3,750 ÷ £8.50 = 442 candles per month

    Step 3 — Break-Even Revenue:

    442 × £14.00 = £6,188 per month

    So Harlow Candles must sell 442 candles — generating £6,188 in revenue — just to cover all costs and break even. Every candle sold beyond that number contributes £8.50 directly to profit.

    The break-even point is not a target — it is a floor. It tells you the minimum you must achieve before profit begins. The real goal is to understand how far above that floor your business is operating, and what it would take to push it lower.

    The Margin of Safety

    Once you know your break-even point, you can calculate the margin of safety — the gap between your actual or expected sales and the break-even level. This tells you how much sales could fall before the business tips into a loss.

    Margin of Safety (Units) = Actual Sales − Break-Even Sales
    Margin of Safety (%) = (Margin of Safety Units ÷ Actual Sales) × 100

    If Harlow Candles currently sells 600 candles per month, its margin of safety is 158 candles (600 − 442), or about 26%. This means sales could drop by a quarter before the business loses money — a reasonable buffer, though tighter than many business owners realise.

    A low margin of safety is an early warning. It means the business is operating close to the break-even line and has limited resilience to unexpected drops in demand, a price cut from a competitor, or an increase in variable costs.

    Using Break-Even Analysis for Business Decisions

    The break-even calculation is most valuable not as a one-time exercise but as a decision-support tool applied repeatedly to different scenarios.

    • Pricing decisions. What happens to break-even if we reduce the price by £1.50 to stay competitive? At £12.50 per candle, the contribution margin drops to £7.00 and the break-even point rises to 536 units — 94 more candles per month just to stand still.
    • Cost increases. If raw material costs rise by 20p per candle, contribution margin falls to £8.30 and break-even rises to 452 units. Is that increase enough to justify a price rise?
    • New product or service. Before launching a new line, calculate its break-even point. Does it reach break-even at a realistic sales volume, or does it require more volume than the market is likely to deliver?
    • Hiring decisions. Adding a part-time employee increases fixed costs by £800/month. How many additional units must be sold to cover that new cost? (£800 ÷ £8.50 = 95 additional candles per month.)
    • Investment appraisal. A new piece of equipment costs £6,000 and reduces variable cost per unit by £0.60. How many units must be sold before the investment pays back through the improved margin?

    In each case, break-even analysis provides a concrete, quantified answer to what would otherwise be a vague judgement call. It does not make the decision — but it ensures the decision is made with clear numbers in hand.

    Limitations to Keep in Mind

    Break-even analysis is a powerful tool, but it rests on simplifying assumptions that are worth acknowledging.

    • Costs are rarely perfectly fixed or variable. In reality, many costs are semi-variable — step costs that jump at certain volume thresholds (a second van, a larger warehouse) create discontinuities that a simple break-even model does not capture.
    • Selling price is assumed constant. Volume discounts, variable pricing, or promotional campaigns mean revenue does not always grow in a perfectly straight line with units sold.
    • It works best for single-product businesses. When a business sells multiple products with different margins, a weighted average contribution margin is needed, which adds complexity and can obscure individual product economics.
    • It is a static snapshot. Break-even analysis reflects costs and prices at a point in time. As costs and prices change, the model needs to be updated to remain useful.

    These limitations do not diminish its usefulness — they simply mean it should be treated as one analytical tool among several, not a complete picture of business performance. Pair it with your cash flow forecast and your income statement for a fuller view of where your business stands.


    Key Takeaways

    • The break-even point is where total revenue equals total costs — the minimum sales level needed before profit begins.
    • Fixed costs stay constant regardless of output; variable costs rise and fall with production. Classifying your costs correctly is the foundation of accurate break-even analysis.
    • Contribution Margin per Unit = Selling Price − Variable Cost per Unit. This figure drives everything: the higher the contribution margin, the lower the break-even point.
    • Break-Even Units = Total Fixed Costs ÷ Contribution Margin per Unit.
    • The margin of safety tells you how far sales can fall before the business makes a loss. A low margin of safety demands attention.
    • Use break-even analysis iteratively — for pricing changes, cost increases, new products, and hiring decisions — rather than as a one-off calculation.

    Related reading: Break-even analysis sits within the broader discipline of management reporting. For the financial statements that give context to your cost structure, see our guides to the Income Statement and the Cash Flow Statement. To understand how break-even fits into the broader picture of business performance measurement, our post on Key Financial Ratios covers the profitability and efficiency metrics that complement break-even thinking. For projecting future cash needs alongside your break-even calculations, see our Cash Flow Forecasting guide.

  • Key Financial Ratios Explained: A Complete Guide to Liquidity, Profitability and Efficiency

    Key Financial Ratios Explained: A Complete Guide to Liquidity, Profitability and Efficiency

    Every business produces financial statements, but the numbers alone rarely tell the full story. A company with £500,000 in revenue might be struggling to pay its suppliers on time, while a business turning a modest profit might be sitting on an exceptionally healthy balance sheet. Financial ratios are the analytical tools that bridge that gap — they transform raw figures into meaningful comparisons that reveal how well a business is really performing. Whether you are an SME owner reviewing your own accounts, an accountant advising a client, or a finance professional preparing management reports, understanding how to read and use financial ratios is one of the most valuable skills you can develop.

    What Are Financial Ratios and Why Do They Matter?

    A financial ratio is simply the relationship between two numbers taken from a company’s financial statements — typically the balance sheet, income statement, or cash flow statement. By expressing one figure as a proportion of another, ratios allow you to assess performance in a way that is comparable across periods, industries, and even different-sized businesses.

    For example, knowing that a company made £80,000 in profit tells you very little by itself. Is that good or bad? It depends on the size of the business, the industry, and what it made last year. But expressing it as a net profit margin of 16% — meaning the company keeps 16p of every pound it earns — immediately gives you a benchmark you can compare against competitors and prior years.

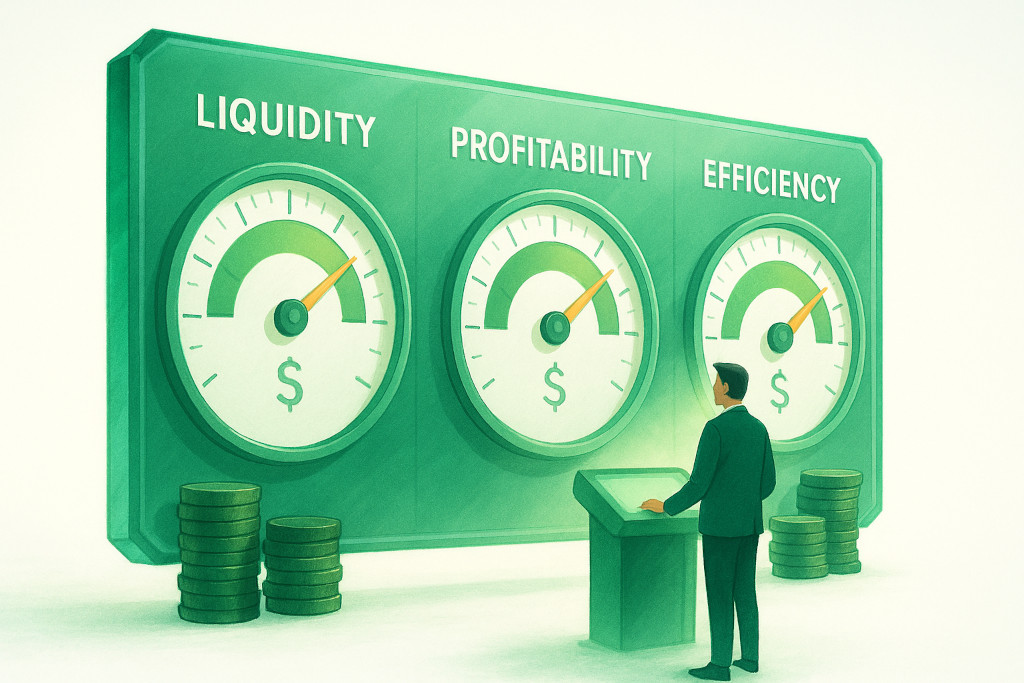
    Financial ratios fall into three main categories: liquidity ratios, which assess whether a business can meet its short-term obligations; profitability ratios, which measure how effectively a business generates profit; and efficiency ratios, which evaluate how well a business uses its assets and manages its operating cycle. Together, they provide a 360-degree view of financial health.

    Liquidity Ratios: Can Your Business Pay Its Bills?

    Liquidity ratios measure a company’s ability to meet its short-term financial obligations — in other words, whether it has enough readily available assets to cover what it owes in the near term. Poor liquidity is one of the most common early warning signs of financial distress, even in otherwise profitable businesses.

    Current Ratio

    The current ratio compares all current assets — cash, receivables, inventory — to all current liabilities due within twelve months.

    Formula: Current Ratio = Current Assets ÷ Current Liabilities

    A ratio above 1.0 indicates the business has more short-term assets than liabilities. Most lenders and analysts look for a current ratio between 1.5 and 2.0. A ratio below 1.0 signals potential liquidity problems; a very high ratio (above 3.0) can suggest assets are not being deployed efficiently.

    Quick Ratio (Acid-Test Ratio)

    The quick ratio is a stricter test that strips out inventory — which may not be quickly convertible to cash — from current assets.

    Formula: Quick Ratio = (Current Assets − Inventory) ÷ Current Liabilities

    A quick ratio of 1.0 or above is generally considered healthy. For businesses with slow-moving stock, such as manufacturers or retailers, this ratio is often more informative than the current ratio.

    Key insight: A business can be profitable on paper and still run out of cash. Liquidity ratios are the earliest warning system — monitor them monthly, not just at year-end.

    Profitability Ratios: Is Your Business Making Money?

    Profitability ratios measure how efficiently a business converts revenue into profit at different stages of the income statement. They are the clearest indicators of whether the core business model is working — and where value is being lost.

    Gross Profit Margin

    Formula: Gross Profit Margin = (Revenue − Cost of Goods Sold) ÷ Revenue × 100

    This ratio shows how much profit a business retains after covering the direct costs of producing its goods or services. A declining gross margin over time often signals rising input costs, supplier price increases, or unsustainable discounting — issues that need to be addressed before they erode the bottom line.

    Net Profit Margin

    Formula: Net Profit Margin = Net Profit After Tax ÷ Revenue × 100

    The net profit margin captures what remains after all costs — including overhead, depreciation, interest, and tax — have been deducted. It is the most comprehensive measure of overall profitability. Industry benchmarks vary significantly: a supermarket might operate on 2–3%, while a software business might target 20% or more.

    Return on Assets (ROA)

    Formula: ROA = Net Profit ÷ Total Assets × 100

    ROA indicates how effectively management is using the company’s asset base to generate earnings. A higher ROA reflects greater efficiency in deploying capital.

    Return on Equity (ROE)

    Formula: ROE = Net Profit ÷ Shareholders’ Equity × 100

    ROE measures the return generated on the funds invested by shareholders. It is one of the most closely watched ratios by investors and business owners alike, as it reflects how much profit the business is generating per pound of owner capital.

    Efficiency Ratios: How Well Are You Using Your Resources?

    Efficiency ratios — sometimes called activity ratios or operating ratios — examine how effectively a business manages its assets and liabilities in its day-to-day operations. They are particularly useful for identifying cash flow problems hidden within the operating cycle.

    Receivables Days (Days Sales Outstanding — DSO)

    Formula: DSO = (Trade Receivables ÷ Revenue) × 365

    This tells you, on average, how many days it takes to collect payment from customers. If your payment terms are 30 days but your DSO is 52 days, you have a collections problem that is directly straining your cash flow.

    Payables Days (Days Payable Outstanding — DPO)

    Formula: DPO = (Trade Payables ÷ Cost of Goods Sold) × 365

    DPO measures how long a business takes to pay its suppliers. A higher DPO can indicate effective cash management — using supplier credit as a free source of finance — but if it stretches too far, it risks damaging supplier relationships.

    Inventory Turnover

    Formula: Inventory Turnover = Cost of Goods Sold ÷ Average Inventory

    This ratio shows how many times a business sells and replaces its inventory in a given period. A high turnover suggests efficient stock management; a low turnover points to excess stock, slow-moving product lines, or potential obsolescence.

    Quick Reference: Key Ratios at a Glance

    RatioFormulaWhat It MeasuresHealthy Range (General Guide)
    Current RatioCurrent Assets ÷ Current LiabilitiesShort-term liquidity1.5 – 2.0
    Quick Ratio(Current Assets − Inventory) ÷ Current LiabilitiesLiquid-only coverage1.0 or above
    Gross Profit Margin(Revenue − COGS) ÷ Revenue × 100Profitability after direct costsVaries by industry
    Net Profit MarginNet Profit ÷ Revenue × 100Overall profitabilityVaries by industry
    Return on AssetsNet Profit ÷ Total Assets × 100Asset efficiency5%+ (higher = better)
    Return on EquityNet Profit ÷ Shareholders’ Equity × 100Return on owner capital15%+ (higher = better)
    DSO (Receivables Days)(Receivables ÷ Revenue) × 365Speed of collectionsClose to your payment terms
    DPO (Payables Days)(Payables ÷ COGS) × 365Supplier payment timingBalanced with DSO
    Inventory TurnoverCOGS ÷ Average InventoryStock management efficiencyHigher = better (sector-dependent)

    Worked Example: Ratios in Practice

    Consider a small manufacturing business, Greenfield Components Ltd, with the following figures for its most recent financial year:

    • Revenue: £1,200,000
    • Cost of Goods Sold: £720,000
    • Net Profit After Tax: £96,000
    • Current Assets: £380,000 (including Inventory of £120,000)
    • Current Liabilities: £210,000
    • Total Assets: £650,000
    • Shareholders’ Equity: £320,000
    • Trade Receivables: £140,000
    • Trade Payables: £85,000

    Running through the key ratios:

    • Current Ratio: 380,000 ÷ 210,000 = 1.81 — healthy liquidity position
    • Quick Ratio: (380,000 − 120,000) ÷ 210,000 = 1.24 — comfortable even without inventory
    • Gross Profit Margin: (1,200,000 − 720,000) ÷ 1,200,000 × 100 = 40%
    • Net Profit Margin: 96,000 ÷ 1,200,000 × 100 = 8%
    • Return on Assets: 96,000 ÷ 650,000 × 100 = 14.8%
    • Return on Equity: 96,000 ÷ 320,000 × 100 = 30% — strong return for shareholders
    • DSO: (140,000 ÷ 1,200,000) × 365 = 42.6 days — slightly above 30-day terms; worth monitoring
    • DPO: (85,000 ÷ 720,000) × 365 = 43.1 days — balanced with DSO; no significant working capital gap

    Overall, Greenfield Components looks financially sound — profitable, liquid, and generating solid returns. The slight overrun on receivables days is the one area worth investigating: if the company could bring DSO down to 35 days, it would free up approximately £17,000 in additional cash flow.

    For businesses managing multiple entities or subsidiaries, tracking ratios at the consolidated group level — as well as entity by entity — provides even richer insight. BrizoConsol’s accountant’s guide to group reporting covers how finance teams can produce consolidated financial statements efficiently, giving ratio analysts the clean, reliable data they need.

    How to Use Financial Ratios Effectively

    Ratios are most powerful when used comparatively — not as one-off snapshots. There are three lenses through which to apply them:

    1. Trend analysis: Compare the same ratio across multiple periods for your own business. A current ratio falling from 2.1 to 1.4 over three years tells a story, even if 1.4 is still technically “acceptable”.
    2. Industry benchmarks: Compare your ratios against sector averages. A 5% net margin is weak for a software company but strong for a supermarket chain. Industry bodies, credit reference agencies, and trade associations often publish benchmark data.
    3. Competitor comparison: Where public financial statements are available, comparing ratios against direct competitors reveals relative strengths and weaknesses in operations, pricing power, and financial management.

    It is also worth remembering that ratios are derived from historical financial statements — they describe where you have been, not necessarily where you are going. Use them alongside cash flow forecasts and budget variance analysis for a forward-looking picture.


    Key Takeaways

    • Financial ratios convert raw accounting figures into meaningful benchmarks for performance analysis.
    • Liquidity ratios (current ratio, quick ratio) reveal whether a business can meet its short-term obligations — monitor these monthly.
    • Profitability ratios (gross margin, net margin, ROA, ROE) measure how effectively the business converts revenue into profit and returns value to owners.
    • Efficiency ratios (DSO, DPO, inventory turnover) highlight how well the business manages its working capital cycle.
    • Ratios are most useful when tracked over time, compared against industry benchmarks, and used alongside forecasts.
    • A single ratio rarely tells the whole story — always interpret ratios together for a balanced view.

    Related reading: Financial ratios draw on all three core financial statements. If you want to deepen your understanding of the numbers that feed into ratio analysis, explore our guides to the key sources: the balance sheet and its structurethe income statement explained for SMEs, and understanding the cash flow statement. For a broader introduction to accounting principles, Accounting Made Simple is a good place to start.