Tag: Tutorial

  • Depreciation Methods Explained: Straight-Line vs Reducing Balance

    Depreciation Methods Explained: Straight-Line vs Reducing Balance

    When a business buys a piece of equipment, a vehicle, or any other long-term asset, that cost doesn’t hit the income statement all at once. It would distort the financials completely — one terrible month followed by years of apparent profitability with no corresponding cost. Instead, accounting spreads the cost of the asset across its useful life through a process called depreciation. But how that cost is spread matters enormously, and the method you choose affects your profit figures, your tax position, and the carrying value of your assets on the balance sheet every single year.

    What Is Depreciation?

    Depreciation is the systematic allocation of the cost of a tangible fixed asset over its expected useful life. It recognises that assets wear out, become obsolete, or lose value over time — and it matches that loss of value to the accounting periods in which the asset is being used to generate income. This is the matching principle at work.

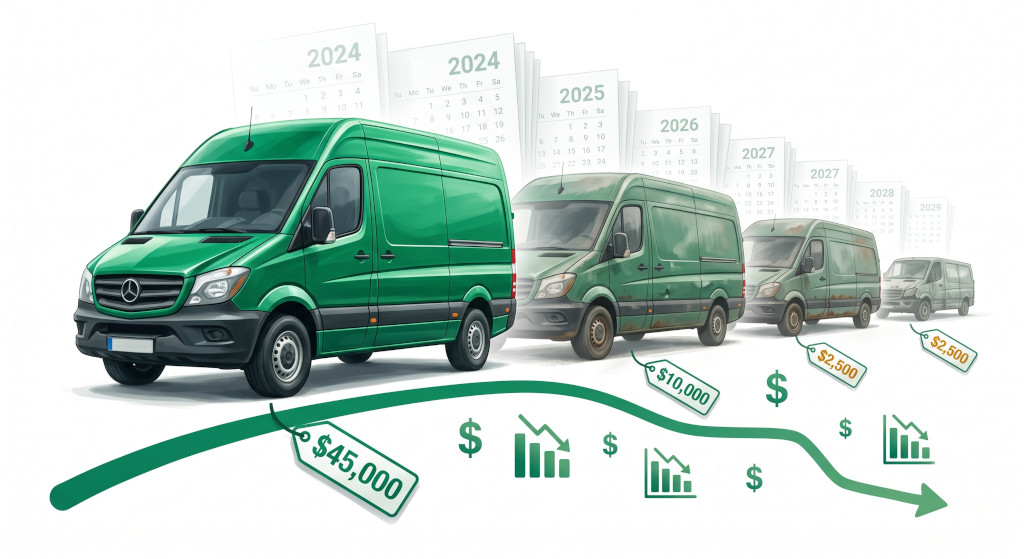
    When you buy a delivery van for £24,000, you don’t expense £24,000 in year one. Instead, you capitalise it on the balance sheet as a non-current asset and then depreciate it gradually, charging a portion of the cost to the income statement each year as a depreciation expense.

    Depreciation is not a cash flow — it’s a non-cash accounting entry. The money left the business when the asset was purchased. Depreciation simply recognises, period by period, that the asset is being consumed in the process of generating revenue.

    Two values matter in depreciation calculations: the cost of the asset (what you paid for it) and the residual value (the estimated amount you’ll receive when you dispose of it at the end of its useful life). The difference between these two figures — the depreciable amount — is what you spread over the asset’s useful life.

    The Straight-Line Method

    The straight-line method is the simplest and most widely used approach. It allocates an equal amount of depreciation in every accounting period across the asset’s useful life. The annual charge never changes — it is the same in year one as it is in the final year.

    The formula is straightforward:

    Annual depreciation = (Cost − Residual value) ÷ Useful life in years

    Using the delivery van example — cost £24,000, residual value £4,000, useful life 4 years:

    Annual depreciation = (£24,000 − £4,000) ÷ 4 = £5,000 per year

    Each year, £5,000 is charged to the income statement as a depreciation expense, and the net book value (NBV) of the van on the balance sheet falls by £5,000. After four years, the van sits on the balance sheet at its residual value of £4,000 and is fully depreciated.

    The straight-line method is favoured for assets that provide roughly equal benefit throughout their lives — office furniture, fixtures and fittings, leasehold improvements, and most plant and machinery fall into this category.

    The Reducing Balance Method

    The reducing balance method — also called the declining balance method — applies a fixed percentage rate to the asset’s net book value at the start of each period, rather than to its original cost. Because the NBV falls each year, the depreciation charge also falls each year, producing a front-loaded pattern of expense that is heavier in the early years and lighter later on.

    The formula is:

    Annual depreciation = Net book value at start of period × Depreciation rate %

    Using the same van at a 25% reducing balance rate:

    • Year 1: £24,000 × 25% = £6,000 depreciation → NBV £18,000
    • Year 2: £18,000 × 25% = £4,500 depreciation → NBV £13,500
    • Year 3: £13,500 × 25% = £3,375 depreciation → NBV £10,125
    • Year 4: £10,125 × 25% = £2,531 depreciation → NBV £7,594

    Notice that the reducing balance method never technically reaches zero — or even the residual value — purely through the formula. In practice, businesses either adjust the final year’s charge or switch to straight-line in the last period to bring the asset down to its residual value.

    The reducing balance method suits assets that are more productive and more valuable in their early years — vehicles, computers, and technology equipment all tend to lose more of their economic value in the first few years of use than in later years.

    Worked Example — Fernwood Interiors Ltd

    Fernwood Interiors Ltd purchases a delivery van on 1 January for £24,000. The expected useful life is 4 years and the estimated residual value is £4,000. The table below shows the depreciation charge and net book value under both methods across the full useful life.

    YearStraight-Line Charge (£)Straight-Line NBV (£)Reducing Balance Charge (£)Reducing Balance NBV (£)
    Start24,00024,000
    Year 15,00019,0006,00018,000
    Year 25,00014,0004,50013,500
    Year 35,0009,0003,37510,125
    Year 45,0004,0002,5317,594
    Total depreciated20,0004,000 ✓16,4067,594

    The straight-line method depreciates the full depreciable amount (£20,000) exactly, landing precisely on the residual value of £4,000. The reducing balance method at 25% has depreciated £16,406 over four years — the van still carries an NBV of £7,594 at year end, above its estimated residual value. Fernwood’s accountant would adjust the rate or the final year’s charge to align the NBV with the expected disposal proceeds.

    The key takeaway from this table: reducing balance front-loads the depreciation charge. In years one and two, the income statement carries a higher expense under reducing balance — which lowers reported profit in those early years but results in lower charges later when the asset is older and perhaps more prone to maintenance costs.

    Which Method Should You Use?

    The choice of depreciation method should reflect how the asset actually loses value and how evenly it contributes to generating revenue over its life. There is no single correct answer — it depends on the type of asset and the accounting standards your business follows.

    Under UK GAAP (FRS 102) and IFRS, businesses must apply a depreciation method that reflects the pattern of consumption of the asset’s economic benefits. In practice, most UK SMEs default to straight-line for simplicity, while businesses with significant vehicle fleets or technology assets often use reducing balance to better match the reality of how those assets depreciate in the real world.

    For tax purposes in the UK, the rules are different. HMRC does not allow businesses to deduct accounting depreciation as a tax expense. Instead, capital allowances — specifically the Annual Investment Allowance (AIA) and Writing Down Allowances (WDAs) — govern how much of a capital purchase can be deducted for tax. The WDA rates (currently 18% for the main pool and 6% for special rate assets) broadly follow a reducing balance approach. This means your accounting depreciation and your tax relief will rarely match exactly in any given year, creating temporary timing differences on your tax computation. For a full breakdown of how capital and revenue expenditure interact with tax, see our guide on capital vs revenue expenditure.

    Once you’ve chosen a method for a class of asset, consistency matters. Switching depreciation methods between periods is permitted under accounting standards but requires disclosure in the financial statements and must be justified as providing more reliable and relevant information. Frequent switches are a red flag for auditors and will raise questions about whether the change is economically justified or cosmetically motivated.

    How Depreciation Appears in the Financial Statements

    Depreciation touches three of your key financial statements, and understanding where it appears in each is important for reading your accounts accurately.

    On the income statement, depreciation appears as an operating expense — usually within administrative expenses or cost of sales, depending on the nature of the asset. It reduces your operating profit and your net profit for the period.

    On the balance sheet, fixed assets are shown at cost less accumulated depreciation — that figure is the net book value. The longer you’ve held an asset and the faster it depreciates, the lower its NBV relative to its original cost. See our guide to understanding the balance sheet for how non-current assets are presented.

    On the cash flow statement (indirect method), depreciation is added back to operating profit in the reconciliation section. Because it is a non-cash charge — no money actually left the business in the period — it must be reversed out of profit to arrive at the true cash generated from operations.

    Key Takeaways

    • Depreciation spreads the cost of a fixed asset across its useful life, matching the expense to the periods in which the asset generates income.
    • The straight-line method charges an equal amount each year — simple, predictable, and suited to assets that provide even benefit over time.
    • The reducing balance method charges a fixed percentage on the declining net book value — front-loading the expense and better reflecting how some assets (vehicles, technology) lose value rapidly in early years.
    • The choice of method should reflect how the asset is actually consumed, not what produces the most convenient profit figure.
    • Depreciation is a non-cash item — it reduces profit but has no direct impact on your bank balance in the period it is charged.
    • For tax purposes in the UK, capital allowances (not accounting depreciation) determine how much of a capital purchase is deductible — these figures will rarely match your accounting charge.

    Related reading: If you found this guide useful, you may also want to read our posts on capital vs revenue expenditureunderstanding the balance sheettrial balance explained, and understanding the income statement.

  • Bad Debts and Provisions Explained: What to Do When Customers Don’t Pay

    Bad Debts and Provisions Explained: What to Do When Customers Don’t Pay

    Any business that sells on credit — invoicing customers and waiting for payment — will eventually face a customer who does not pay. It might be a long-standing client who runs into financial difficulty, a one-off customer who disputes the invoice, or a debtor who simply disappears. However it happens, the result is the same: money you recorded as income and carried as an asset on your balance sheet may not materialise. How you account for that risk — both before it crystallises and after it does — is the subject of bad debt accounting. Getting it right keeps your financial statements honest and ensures your profit is not overstated by income you are unlikely ever to collect.

    Two Concepts: Bad Debts and Doubtful Debts

    Before getting into the accounting, it is worth being clear on the distinction between two related but different concepts.

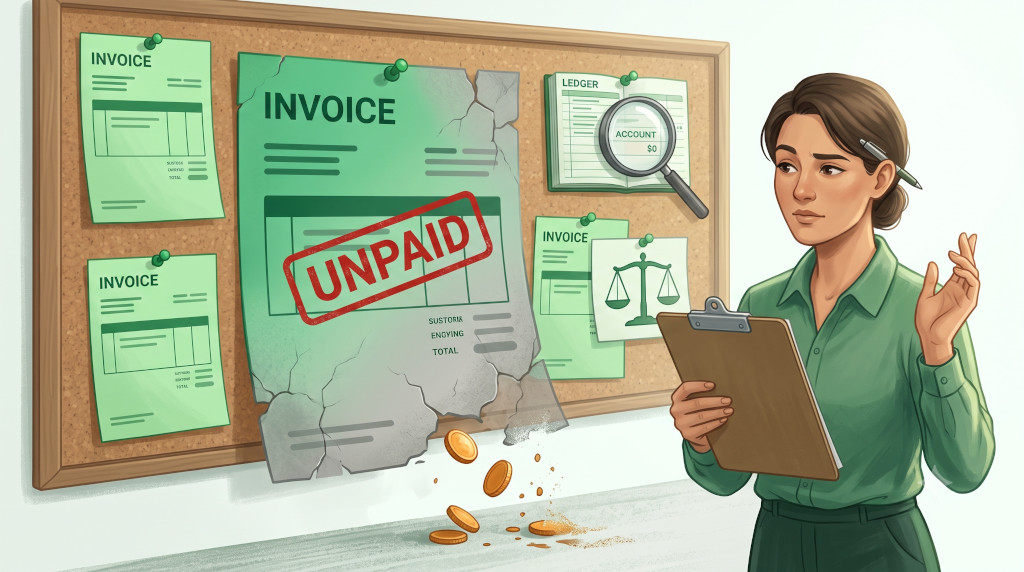
    bad debt is a specific debt that you have determined is irrecoverable. You have exhausted reasonable efforts to collect — chased the customer, involved a debt recovery agency, or learned the customer has gone into liquidation — and you have concluded the amount will not be received. At this point, you write the debt off: you remove it from your debtors (accounts receivable) and recognise the loss as an expense.

    doubtful debt is a debt where recovery is uncertain but not yet confirmed as impossible. The customer is overdue, in financial difficulty, or unresponsive — but you have not yet abandoned hope. Rather than waiting for certainty, prudent accounting requires you to create a provision for doubtful debts: an estimate of the amount you may not collect, recognised as an expense now, while the debtor balance remains on the books.

    Key insight: The difference is certainty. A bad debt write-off is definitive — the debt is gone. A provision for doubtful debts is an estimate — the debt is still there on the balance sheet, but its net value is reduced to reflect the risk of non-collection. Both are applications of the prudence concept: do not overstate assets or income.

    Writing Off a Bad Debt: The Accounting Entries

    When you decide a specific debt is irrecoverable and write it off, the journal entry removes the debtor from the balance sheet and records the loss as an expense.

    Assuming a customer owes £1,500 and you have concluded the debt is bad:

    AccountDebitCreditExplanation
    Bad Debt Expense (P&L)£1,500Records the loss as an expense, reducing profit
    Accounts Receivable / Debtors (Balance Sheet)£1,500Removes the uncollectable debt from current assets

    The effect: profit falls by £1,500, and the debtors balance on the balance sheet falls by £1,500. The original sale revenue recorded when the invoice was raised is not reversed — revenue was recognised when earned. The write-off records the subsequent failure to collect as a separate loss.

    What If the Customer Later Pays?

    Occasionally a debt written off is subsequently recovered — the customer pays after all. In this case, you reverse the write-off (reinstating the debtor) and then record the cash receipt in the usual way. The recovery is recorded as income — typically in a “bad debts recovered” account — so it is transparent in the accounts rather than buried.

    Creating a Provision for Doubtful Debts

    A provision takes a forward-looking view: rather than waiting for specific debts to become irrecoverable, you estimate the proportion of your overall debtor book that is unlikely to be collected, and recognise that estimate as a provision (a liability reducing the net debtor balance) before the outcome is known.

    There are two common approaches to calculating the provision.

    Specific Provision

    You identify individual debtors that are at risk and estimate the amount unlikely to be recovered from each. This is the most accurate method and is required under accounting standards (IFRS 9 and FRS 102’s expected credit loss model) for any material balance. For example, if Customer A owes £8,000 and is known to be in administration, you might provide for 80% of the balance: a provision of £6,400.

    General (Percentage) Provision

    Alternatively, you apply a percentage to the aged debtor balance to estimate overall expected losses. The percentage might be based on historical experience — if 2% of your debtors typically prove irrecoverable over time, you provision at 2%. This approach is less precise but practical for businesses with large numbers of small balances where individual assessment is impractical.

    Many businesses use a tiered approach based on how long each debt has been outstanding:

    Age of DebtProvision RateRationale
    0–30 days overdue0%Recent — expected to collect in normal course
    31–60 days overdue5%Slightly late — low but non-zero risk
    61–90 days overdue20%Noticeably overdue — elevated risk
    91–180 days overdue50%Significantly overdue — material risk of loss
    Over 180 days overdue90%Likely irrecoverable — consider specific write-off

    Provision Journal Entries

    When you create or increase a provision for doubtful debts:

    AccountDebitCreditExplanation
    Bad Debt Expense / Doubtful Debt Expense (P&L)£XReduces profit by the estimated loss
    Provision for Doubtful Debts (Balance Sheet — contra asset)£XReduces the net debtor balance presented on the balance sheet

    The provision sits as a contra asset — it does not remove the gross debtor balance (the customer still owes the money), but it reduces the net amount shown, reflecting that not all of it is expected to be collected. On the balance sheet, you might see: Trade Debtors £45,000 less Provision for Doubtful Debts (£2,700) = Net Debtors £42,300.

    At each period end, the provision is reviewed and adjusted — increased if the debtor book has grown or aged, decreased if collections have improved or specific debts have been written off against it.

    Worked Example: Thornfield Design

    Thornfield Design is a creative agency. At 31 March 2026 (year-end), the debtors ledger shows a total balance of £62,000. The bookkeeper analyses the age of the debt and identifies the following:

    CustomerAmount OwedStatusTreatment
    Client A£4,200In liquidation — no recovery expectedWrite off in full as bad debt
    Client B£9,000120 days overdue, disputing invoiceSpecific provision: 50% = £4,500
    Remaining debtors£48,800Mix of 0–90 days overdueGeneral provision at 3% = £1,464

    Step 1 — Write off Client A:
    Debit Bad Debt Expense £4,200 / Credit Debtors £4,200.
    Debtors balance falls to £57,800.

    Step 2 — Create provision for Client B and general book:
    Total provision required: £4,500 + £1,464 = £5,964.
    Debit Doubtful Debt Expense £5,964 / Credit Provision for Doubtful Debts £5,964.

    Balance sheet presentation at 31 March 2026:

    Item£
    Trade debtors (gross, after write-off)57,800
    Less: Provision for doubtful debts(5,964)
    Net trade debtors51,836

    P&L impact: Total bad debt and doubtful debt expense for the year = £4,200 + £5,964 = £10,164, reducing gross profit by that amount.

    VAT on Bad Debts

    For VAT-registered businesses in the UK, there is an additional consideration. When you originally raised the invoice, you paid VAT to HMRC on that sale. If the debt becomes irrecoverable and you write it off, you may be eligible to claim Bad Debt Relief — reclaiming the VAT you already paid over to HMRC on the unpaid invoice. To qualify, the debt must be more than six months old from the date payment was due, must have been written off in your accounts, and you must have originally accounted for VAT on the supply. Keep records of the original invoice, the write-off, and your VAT claim.

    Why This Matters for Your Management Accounts

    Bad debt accounting is not just a year-end tidying exercise — it affects how you read your monthly management accounts throughout the year. An accounts receivable balance that includes large amounts of aged, uncollected debt overstates your current assets and makes the business look more liquid than it actually is. Our guide to accounts receivable and accounts payable covers the broader mechanics of managing your debtor book, including credit terms and collection processes that help prevent bad debts from arising in the first place.

    Running an aged debtor report monthly — and provisioning regularly rather than only at year-end — keeps your management accounts realistic and helps you spot credit risk early, before it becomes a write-off. For groups with multiple entities, ensuring consistent provisioning policies across subsidiaries is important for presenting a reliable consolidated picture; BrizoConsol’s guide on preparing for audit with consolidated financials discusses how these policy consistencies are scrutinised at the group reporting level.


    Key Takeaways

    • bad debt write-off removes a specific irrecoverable debt from the balance sheet and records it as an expense in the P&L, reducing profit. The original revenue is not reversed.
    • provision for doubtful debts estimates the amount of the debtor book unlikely to be collected, recognised as an expense before the outcome is certain. It sits as a contra asset, reducing the net debtor balance on the balance sheet.
    • The journal entries for a write-off: Debit Bad Debt Expense / Credit Debtors. For a provision: Debit Doubtful Debt Expense / Credit Provision for Doubtful Debts.
    • Provisions can be specific (applied to identified at-risk debtors) or general (a percentage applied to the aged debtor book), or a combination of both.
    • Review and adjust your provision at every period end — as debts age, are recovered, or are written off, the provision should move accordingly.
    • VAT-registered businesses in the UK may be able to reclaim VAT on written-off debts via Bad Debt Relief, subject to qualifying conditions.
    • Regular aged debtor reporting and timely provisioning keeps your management accounts honest and surfaces credit risk early.

    Related Reading

  • Capital Expenditure vs Revenue Expenditure: What’s the Difference and Why It Matters for Your Business

    Capital Expenditure vs Revenue Expenditure: What’s the Difference and Why It Matters for Your Business

    When a business spends money, not every payment is treated the same way in the accounts. A £300 printer cartridge and a £30,000 piece of manufacturing equipment are both costs — but they land in completely different places in your financial statements, affect your profit in entirely different ways, and have different tax implications. The distinction that determines how each is treated is one of the most fundamental in accounting: is this capital expenditure or revenue expenditure? Getting this right matters not just for producing accurate accounts, but for ensuring you claim the right tax reliefs at the right time and present an honest picture of your business’s assets and profitability.

    What Is Capital Expenditure?

    Capital expenditure (CapEx) is spending on assets that will provide economic benefit to your business over more than one accounting period. When you buy a piece of machinery, a company vehicle, a building, computer equipment, or any other asset with a multi-year useful life, that is capital expenditure.

    The defining characteristic is duration: the asset will contribute to generating revenue not just now, but in future periods too. Because of this, accounting standards require that the cost is not written off immediately against profit. Instead, it is recognised as an asset on the balance sheet and then gradually expensed over the asset’s useful life through depreciation. This matching of cost to benefit — spreading the expenditure across the periods in which the asset earns its keep — is the practical application of the matching principle discussed in our guide to double-entry bookkeeping and journal entries.

    Common examples of capital expenditure include property purchases or improvements, machinery and equipment, vehicles, computer hardware, leasehold improvements, and the development costs of software or other intangible assets (subject to specific criteria).

    What Is Revenue Expenditure?

    Revenue expenditure (sometimes called operational expenditure or OpEx) is spending that is consumed within the current accounting period. It relates to the day-to-day running of the business: rent, utilities, wages, stationery, repairs, insurance, advertising, and similar costs. These expenses are charged directly to the profit and loss account in the period they are incurred, reducing profit immediately.

    The key distinction from capital expenditure is that revenue expenditure either has no lasting economic benefit beyond the current period, or it relates to maintaining an existing asset rather than enhancing it. Painting your office walls is revenue expenditure (maintenance). Adding a new floor to the building is capital expenditure (enhancement).

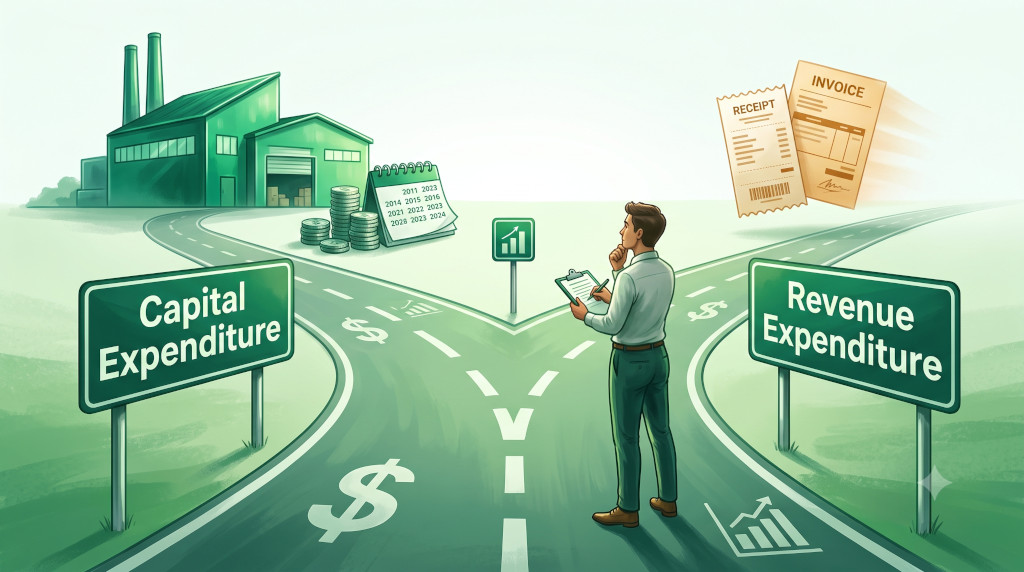
    Key insight: The question to ask is: does this spending create or enhance a long-term asset, or does it simply keep the business running today? If it creates lasting value — it is CapEx, and it goes on the balance sheet. If it keeps operations running without creating a new asset — it is revenue expenditure, and it goes straight to the P&L.

    How the Classification Affects Your Accounts

    The accounting treatment for each type of expenditure is fundamentally different, and the impact flows through both the balance sheet and the profit and loss account.

    FeatureCapital ExpenditureRevenue Expenditure
    Where it goesBalance sheet (fixed assets)Profit & Loss account (expenses)
    Profit impactSpread over useful life via depreciationReduces profit immediately in full
    Cash impactFull cash outflow on purchase dateFull cash outflow when paid
    Balance sheet effectIncreases fixed assets (gross); reduces via accumulated depreciationNo balance sheet entry (passes through P&L)
    Tax treatment (UK example)Capital allowances claimed over timeDeducted in full in the year incurred
    ExampleBuying a delivery van for £25,000Insuring that van for £1,200 per year

    Note an important nuance: the cash impact is the same on day one regardless of classification. The company pays £25,000 for the van — the cash leaves the bank immediately. The difference is purely in how that outflow is recognised in the accounts: gradually through depreciation (CapEx) or all at once (revenue expenditure). This is why a business can be profitable on paper but still face cash pressure after a major capital investment — the profit and loss account only shows the year’s depreciation charge, while the full purchase price has already left the bank account.

    The Tax Dimension: Why Getting This Right Matters

    Misclassifying capital and revenue expenditure has direct tax consequences. In the UK, revenue expenditure is deductible in full in the accounting period it is incurred — reducing your taxable profit pound for pound. Capital expenditure is not deducted as an expense; instead, you claim capital allowances, which are the tax equivalent of depreciation (though calculated using HMRC’s own rates rather than your accounting depreciation charge).

    The Annual Investment Allowance (AIA) allows most SMEs to deduct the full cost of qualifying capital expenditure in the year of purchase — which can be highly tax-efficient. But to claim it, the expenditure must first be correctly classified as capital. If a business mistakenly treats capital expenditure as a revenue expense, it may claim a deduction it is not entitled to — which can result in penalties if HMRC identifies the error. Conversely, if it treats revenue expenditure as capital, it will under-claim in the current year and over-state its asset base.

    The tax rules vary by jurisdiction, so always confirm the treatment that applies to your business with a qualified accountant — but the principle that classification affects both your accounts and your tax position is universal.

    Worked Example: Birchwood Bakery

    Birchwood Bakery is a small food production business. In the financial year ending 31 March 2026, it incurs the following expenditures. The owner needs to classify each correctly before preparing the accounts.

    ItemCostClassificationReasoning
    New commercial oven£12,000CapitalLong-lived asset providing benefit over several years; goes to balance sheet, depreciated over useful life
    Annual service of existing oven£350RevenueMaintenance to keep existing asset running — does not enhance or extend its life materially
    New shelving unit for storage room£800CapitalPermanent fixture; enhances the business’s physical capacity over multiple years
    Flour, butter, and packaging (consumables)£9,200RevenueConsumed directly in producing goods for sale — expensed in the period as cost of goods sold
    Repainting the shopfront£1,100RevenueRestores to existing condition; does not increase the asset’s value or extend its useful life
    Website rebuild (new e-commerce features)£4,500CapitalEnhances and extends a long-term digital asset; capitalised and amortised over its expected useful life

    The two items that often cause confusion are the oven service and the shopfront repaint. Both involve spending on existing physical assets. The test is whether the spending restores the asset to its original condition (revenue) or improves or extends it (capital). A £350 annual service is clearly maintenance — it keeps the oven running as it should. If Birchwood instead upgraded the oven’s burner system to increase its capacity and extend its life by five years, that upgrade would be capital expenditure.

    Common Areas of Confusion

    Several categories of spending regularly cause uncertainty for SME owners and bookkeepers. Here are the most common grey areas.

    Repairs vs improvements. As noted above, the line between repairing an asset (revenue) and improving it (capital) is the most frequent source of misclassification. A new roof that replaces a damaged one like-for-like is arguably revenue; a roof replaced with a superior material that extends the building’s life is capital.

    Software. Purchased off-the-shelf software with a perpetual licence is typically capital expenditure. Software-as-a-Service (SaaS) subscription fees paid monthly or annually are revenue expenditure. The distinction matters enormously as more businesses shift to cloud-based tools — all those SaaS costs are P&L expenses, not assets.

    Low-value assets. Most businesses set a capitalisation threshold — a minimum cost below which items are expensed as revenue expenditure even if they technically meet the definition of an asset. A £50 stapler has an expected life of several years, but no business capitalises it. A common threshold for SMEs is £500 or £1,000 — spending below this is written off immediately. The threshold should be set consistently and disclosed in the accounting policies.

    Initial setup costs. Legal fees, installation costs, and delivery charges that are directly attributable to bringing a capital asset into use are generally added to the cost of the asset (capitalised) rather than expensed. The cost of an asset is everything required to get it into its working condition — not just the purchase price itself. You can read more about how assets are valued and carried in our guide to depreciation methods, which covers how capital assets are expensed over time.


    Key Takeaways

    • Capital expenditure is spending on assets that provide economic benefit over more than one accounting period. It goes on the balance sheet and is expensed gradually through depreciation.
    • Revenue expenditure is spending consumed within the current period — day-to-day running costs and maintenance. It goes directly to the profit and loss account and reduces profit in full immediately.
    • Cash leaves the business on the same day regardless of classification. The difference is in how and when the cost is recognised in the accounts.
    • Misclassification has tax consequences: revenue expenditure is typically deductible in full in the year incurred; capital expenditure is recovered through capital allowances over time (though reliefs like the Annual Investment Allowance can accelerate this).
    • The key test for any spending: does it create or enhance a long-term asset, or does it maintain the business’s existing ability to operate? Enhancement = capital; maintenance = revenue.
    • Most businesses set a capitalisation threshold — spending below a set amount is written off as revenue expenditure regardless of asset life. Apply this threshold consistently.
    • When in doubt about the correct classification, particularly for material amounts, consult a qualified accountant — the tax and reporting implications make this one area where getting it right from the outset is considerably easier than correcting it later.

    Related Reading

    Capital and revenue expenditure classification connects directly to how your balance sheet and profit and loss account are structured. These ARD guides provide the broader context:

  • Accruals and Prepayments Explained: The Accounting Entries Every SME Owner Needs to Understand

    Accruals and Prepayments Explained: The Accounting Entries Every SME Owner Needs to Understand

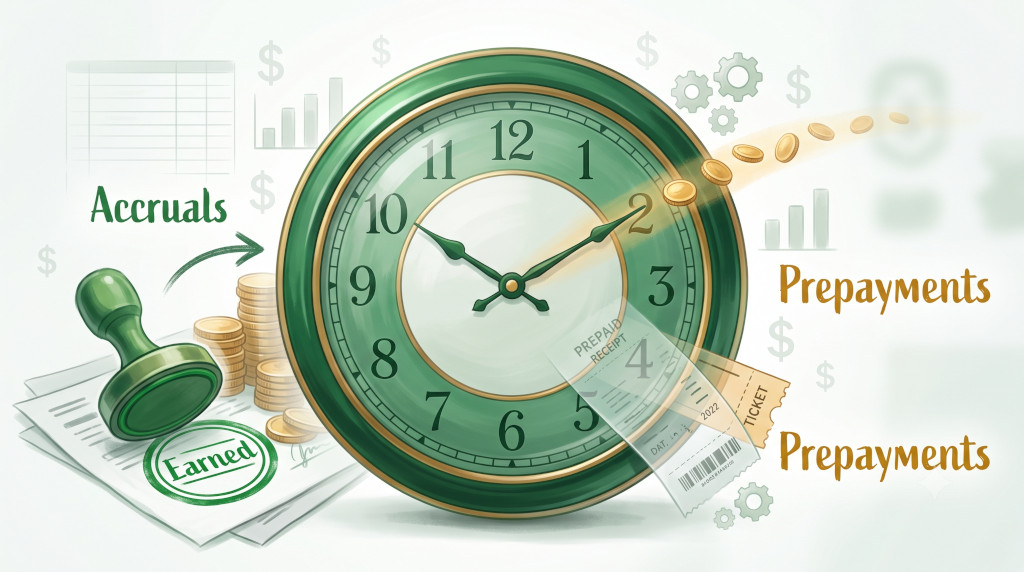
    If you have ever looked at a set of accounts and noticed entries for things like “accrued expenses” on the balance sheet or “prepayments” in the current assets section, you have encountered one of the most important — and most misunderstood — principles in accounting. Accruals and prepayments exist because of a fundamental rule: income and expenses must be recognised in the accounting period they belong to, not simply when money changes hands. For SME owners moving beyond basic bookkeeping, understanding this principle is the difference between accounts that tell you the truth about your business and accounts that give you a distorted picture of your profitability.

    Why Timing Matters in Accounting: The Matching Principle

    Most people think of money in terms of cash: you earn it when it lands in the bank and spend it when it leaves. But accrual accounting — the method required for most formal sets of accounts — operates on a different logic. It follows the matching principle: revenues and expenses should be matched to the period in which the underlying economic activity occurs, regardless of when the cash actually moves.

    Consider a simple example. You pay your business insurance for the year in January: £2,400 in a single lump sum. Under cash accounting, that entire cost hits your January profit and loss statement. Under accrual accounting, £200 of insurance cost is recognised each month — because each month you are using one month’s worth of cover. The remaining unused portion sits on the balance sheet as a prepayment (an asset — money you have paid for something you haven’t yet received).

    The matching principle produces accounts that reflect the economic reality of what happened during a period, rather than the happenstance of when payments were timed. It is why almost every business using formal accounts — whether to comply with company law, to present to a bank, or to get an accurate read on profitability — operates on an accruals basis.

    The Four Types: Accruals and Prepayments Unpacked

    There are four distinct adjustments that fall under the accruals and prepayments umbrella. Two relate to expenses; two relate to income.

    1. Accrued Expenses (Accruals)

    An accrued expense is a cost you have incurred during the accounting period but have not yet paid or received an invoice for. The economic event has happened; the cash has not moved yet.

    Common examples include electricity and gas bills that run to the end of the month but arrive several weeks later, wages for the final few days of a month that are paid in the following month, or professional fees for work completed but not yet invoiced. The cost belongs to the current period, so it must be recognised now — even without a payment or invoice to match.

    In double-entry terms, you debit the relevant expense account (increasing the expense in your P&L) and credit an “accruals” or “accrued expenses” liability on the balance sheet. When the payment eventually arrives, you reverse the accrual entry and record the actual payment.

    2. Prepaid Expenses (Prepayments)

    A prepaid expense is the mirror image: you have paid for something in advance that covers a future period. Part of the payment belongs to the current period; the remainder belongs to one or more future periods.

    Insurance paid annually, software subscriptions paid quarterly, and rent paid in advance are all classic prepayments. The portion relating to the current period is expensed through the P&L; the unused portion is held on the balance sheet as a current asset — money owed to you in the form of future economic benefit.

    3. Accrued Income

    Accrued income arises when you have earned revenue during the period but have not yet issued an invoice or received payment. You have delivered the service or supplied the goods; the income belongs to this period. A consultant who completes a project in December but invoices in January must still recognise the income in December under the accruals basis.

    The accounting entry records the income in the P&L and carries a corresponding debtor (receivable) on the balance sheet — an amount owed to the business that has not yet been formally invoiced.

    4. Deferred Income

    Deferred income is the opposite: you have received cash from a customer for something you have not yet delivered or earned. A deposit taken for a job not yet started, or an annual subscription received upfront, creates deferred income. The cash is in the bank, but the income is not yours yet — you still have an obligation to perform.

    On the balance sheet, deferred income sits as a liability. As you deliver the service or product over time, you recognise the income progressively through the P&L.

    Key insight: Accruals and prepayments are timing adjustments — they ensure the right amount of income and expense lands in the right accounting period, regardless of when money moves. At the end of every period, these entries are reviewed and reversed or updated as appropriate.

    How Accruals and Prepayments Appear in Your Financial Statements

    Once you understand the four types, it becomes straightforward to trace where they appear in a standard set of accounts.

    Entry TypeP&L EffectBalance Sheet Effect
    Accrued ExpenseIncreases expenses in the current periodCreates a liability (accruals / creditors)
    Prepaid ExpenseReduces expense recognised in the current periodCreates a current asset (prepayments)
    Accrued IncomeIncreases revenue in the current periodCreates a current asset (accrued income / debtors)
    Deferred IncomeReduces revenue recognised in the current periodCreates a liability (deferred income)

    If your balance sheet shows a line for prepayments under current assets, it represents money you have already paid for goods or services that relate to a future period — an economic benefit the business will receive. If it shows accruals under current liabilities, it represents costs already incurred that have not yet been settled in cash.

    A Worked Example: Hartley Studio

    Hartley Studio is a small creative agency preparing accounts for the financial year ending 31 March 2026. As the year-end approaches, the bookkeeper identifies four timing adjustments needed:

    SituationTypeP&L AdjustmentBalance Sheet
    Electricity bill for March not yet received — estimated £340Accrued Expense+ £340 utilities expense+ £340 accruals (liability)
    Annual software licence paid Jan 2026 — £1,200. 3 months remain after year-end.Prepaid Expense− £300 software expense (future months)+ £300 prepayments (asset)
    Design project delivered in March — client invoice not yet raised — £2,500Accrued Income+ £2,500 revenue+ £2,500 accrued income (asset)
    Deposit received in February for project starting April — £800Deferred Income− £800 revenue (not yet earned)+ £800 deferred income (liability)

    Without these four adjustments, Hartley Studio’s year-end accounts would understate expenses by £340, overstate expenses by £300 (software charged entirely to this year), miss £2,500 of revenue earned but not yet invoiced, and include £800 of revenue not yet earned. The net distortion would render the profit figure unreliable.

    Each of these adjustments is reversed at the start of the following period, and the actual transactions then replace them as they occur — a clean mechanism that keeps each period’s accounts accurate.

    Why Accruals and Prepayments Matter for Your Business

    For any SME preparing formal accounts — whether for Companies House, for a bank loan application, or simply for reliable management information — getting accruals and prepayments right is not optional. Here is why it matters in practice.

    Accurate profitability. If large expenses routinely hit the P&L in the wrong month, your monthly profit figures are noise rather than signal. A business that pays an annual insurance premium in January will show an apparently unprofitable January and falsely profitable months for the rest of the year — making it impossible to track trends or spot problems.

    Correct balance sheet values. Prepayments are genuine assets — cash you have committed that will generate future economic benefit. Accrued income is money you have genuinely earned. Omitting these distorts the balance sheet and can misrepresent the business’s financial position to lenders, investors or potential buyers.

    Reliable management accounts. If you use monthly management accounts to run your business, accruals and prepayments are what make those accounts comparable month to month. Without them, you are looking at a cash flow statement dressed up as a P&L. You can read more about the role of management accounts in our guide to management accounts vs statutory accounts.

    Audit readiness. Accruals are among the most scrutinised items in any audit. Poorly documented or missing accrual entries — particularly for material year-end expenses — are a common source of audit queries and adjustments. For businesses that consolidate across multiple entities, ensuring consistent accrual treatment across all subsidiaries is an additional layer of complexity; BrizoConsol’s guide on preparing for audit with consolidated financials covers how groups manage this at the reporting level.

    Tax implications. In most jurisdictions, taxable profit is calculated on an accruals basis. Misclassifying or omitting accruals can therefore affect the tax you report, potentially creating under- or over-payment that the tax authority may later challenge.


    Key Takeaways

    • Accruals and prepayments are timing adjustments that ensure income and expenses are recognised in the accounting period they belong to — not simply when cash moves. This is called the matching principle.
    • There are four types: accrued expenses (costs incurred but not yet paid), prepaid expenses (costs paid in advance for future periods), accrued income (revenue earned but not yet invoiced), and deferred income (cash received for services not yet delivered).
    • Accruals and prepayments create entries on both the P&L and the balance sheet: liabilities for costs owed or income received early, and assets for payments made in advance or income earned but not yet received.
    • Without these adjustments, monthly and annual accounts will misrepresent profitability, distort the balance sheet, and make period-to-period comparisons unreliable.
    • All accrual and prepayment entries are reversed at the start of the following period, and replaced by the actual transactions as they occur.
    • Accruals are among the most closely reviewed items in a year-end audit — accurate, well-documented entries significantly reduce the chance of adjustments.

    Related Reading

    Accruals and prepayments connect directly to how your financial statements are constructed and how your business records transactions. These ARD guides provide the essential context:

  • Break-Even Analysis Explained: How to Find the Point Where Your Business Starts Making Money

    Break-Even Analysis Explained: How to Find the Point Where Your Business Starts Making Money

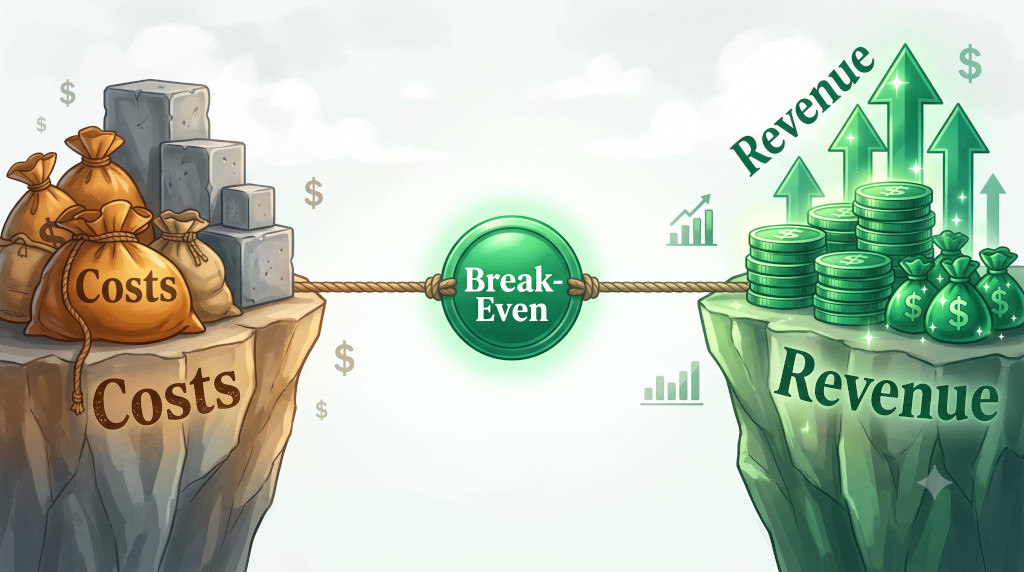
    Every business owner has felt it: you’re generating revenue, paying your bills, watching money flow in and out — but you’re not sure whether you’re actually profitable yet, or how much you need to sell before you are. Break-even analysis answers that question with precision. It tells you the exact point at which your revenue covers all your costs, leaving neither a profit nor a loss. Below that point, every sale contributes to covering your overheads. Above it, you’re making money. Understanding where that line sits is one of the most useful things any SME owner can know about their business.

    What Is Break-Even Analysis?

    Break-even analysis is the process of calculating the sales volume — in units or in revenue — at which a business’s total income exactly equals its total costs. At the break-even point, profit is zero: you are covering everything you spend, but not yet generating surplus.

    The concept underpins a huge range of financial decisions: setting selling prices, evaluating the viability of a new product line, planning how many units to produce, assessing the impact of taking on a new lease, or deciding whether a marketing campaign will pay for itself. It is a core tool in management accounting precisely because it converts cost data into an actionable threshold — a target to hit before profitability begins.

    Break-even analysis is built on one foundational distinction: the difference between fixed costs and variable costs.

    Fixed Costs vs. Variable Costs: Why the Difference Matters

    To run a break-even calculation, you need to split your costs into two categories.

    Fixed costs are expenses that remain constant regardless of how much you produce or sell. Rent, insurance premiums, salaried staff, software subscriptions and loan repayments are fixed costs. Whether you sell 10 units or 10,000 units this month, your rent stays the same. These costs exist simply because you are operating.

    Variable costs are expenses that rise or fall in direct proportion to your output. Raw materials, packaging, sales commissions, delivery costs and hourly labour are typically variable. If you sell twice as many products, your variable costs roughly double.

    The practical importance of this split is that it isolates what each additional unit of sale actually costs you to produce — and how much of the selling price is available to cover your fixed overheads. That available amount is called the contribution margin.

    Key insight: The contribution margin is the portion of each sale that “contributes” to covering your fixed costs. Once fixed costs are fully covered, every additional pound of contribution margin becomes profit.

    The formula is straightforward:

    Contribution Margin = Selling Price per Unit − Variable Cost per Unit

    If you sell a product for £50 and it costs you £20 in variable costs to produce and ship each unit, your contribution margin per unit is £30.

    Calculating Your Break-Even Point

    Once you know your fixed costs and contribution margin, the break-even formula is simple:

    Break-Even Point (in units) = Total Fixed Costs ÷ Contribution Margin per Unit

    You can also express this as a revenue figure:

    Break-Even Point (in revenue) = Total Fixed Costs ÷ Contribution Margin Ratio

    Where: Contribution Margin Ratio = Contribution Margin per Unit ÷ Selling Price per Unit

    These two formulas give you the same answer expressed in different units — which is useful depending on whether you think in terms of items sold or money collected.

    Worked Example: Orchard & Co.

    Suppose Orchard & Co. is a small business selling handmade ceramic mugs online. Here is their cost structure:

    ItemMonthly AmountCost Type
    Studio rent£1,200Fixed
    Owner salary (fixed draw)£1,800Fixed
    Website subscription & insurance£200Fixed
    Total Fixed Costs£3,200
    Clay and glazes per mug£8Variable
    Packaging & shipping per mug£7Variable
    Total Variable Cost per Unit£15
    Selling price per mug£45
    Contribution Margin per Unit£30

    Applying the formula:

    Break-Even Point = £3,200 ÷ £30 = 107 mugs per month

    Orchard & Co. needs to sell 107 mugs every month before they make a single pound of profit. Expressed as revenue:

    Contribution Margin Ratio = £30 ÷ £45 = 66.7%
    Break-Even Revenue = £3,200 ÷ 0.667 = £4,798 per month

    In other words, the business needs to generate just under £4,800 in monthly sales to break even. Sale 108 onwards is pure profit at a margin of £30 each.

    How to Use Break-Even Analysis in Practice

    The real value of break-even analysis is not the number itself — it is what you do with it.

    Pricing decisions. If your current selling price produces a contribution margin so thin that the break-even point is unrealistic (say, 3,000 units a month when you typically sell 400), your price is too low or your variable costs are too high. Break-even analysis makes this structural problem visible immediately.

    Evaluating new costs. Considering hiring a part-time member of staff at £800 a month? That increases your fixed costs and raises your break-even point. You can calculate exactly how many additional units you need to sell to justify the hire before committing.

    Stress-testing scenarios. If your supplier raises material costs, how does that affect your contribution margin and break-even volume? If you discount your price for a sale campaign, does the increased volume required to compensate make commercial sense? Break-even analysis lets you model these scenarios quickly.

    Assessing product viability. For a new product line, build a break-even model before launch. If the numbers require an implausible sales volume to cover development and marketing costs, it may not be the right moment to proceed.

    For businesses operating across multiple entities or product lines, understanding break-even at both the entity and group level adds another layer of insight. BrizoConsol’s guide on group KPI reporting for multi-entity businesses explores how finance teams track profitability and performance metrics consistently across different parts of the group.

    Limitations of Break-Even Analysis

    Break-even analysis is powerful, but it rests on a set of assumptions that do not always hold in the real world. Understanding these limitations helps you use the tool intelligently rather than treating its output as certainty.

    First, the model assumes that all fixed costs remain truly fixed and that variable costs scale perfectly linearly with output. In practice, step-costs exist: hiring a second member of staff, for example, creates a jump in fixed costs once volume reaches a certain point — this is not captured in a simple break-even model.

    Second, the analysis typically treats your product mix as constant. If you sell multiple products with different contribution margins, your overall break-even depends on which products you sell and in what proportions — a concept known as the weighted-average contribution margin. A business that suddenly sells proportionally more low-margin products will find its break-even point rises even if total revenue holds steady.

    Third, break-even analysis looks only at costs and revenue — it does not account for cash timing. A business can be above its break-even point on paper and still face cash flow shortfalls if customers pay 60 days late. Always pair break-even analysis with a cash flow view. You can explore this further in our guide to cash flow forecasting for SMEs.

    Finally, break-even analysis is a snapshot. As your cost structure evolves — rent reviews, wage increases, changes in supplier pricing — the model needs updating. Build it into your regular financial review cycle, not just as a one-off exercise at launch.


    Key Takeaways

    • Break-even analysis identifies the exact sales volume at which total revenue equals total costs — profit is zero at this point; every additional unit sold beyond it generates profit.
    • Fixed costs stay constant regardless of output (rent, salaries, insurance); variable costs rise with production (materials, packaging, commissions).
    • Contribution margin = selling price minus variable cost per unit. This is the portion of each sale available to cover fixed costs.
    • Break-Even Point (units) = Total Fixed Costs ÷ Contribution Margin per Unit.
    • Break-even analysis is most useful for pricing decisions, evaluating new costs, stress-testing scenarios, and assessing the viability of new products or services.
    • The model has limitations: it assumes fixed cost stability, linear variable costs, and a constant product mix — supplement it with cash flow analysis and a multi-product contribution margin view where relevant.
    • Revisit your break-even model whenever your cost structure changes materially.

    Related Reading

    Break-even analysis is most useful when paired with a broader understanding of your financial statements and cost structure. These ARD guides cover the essential context:

  • Cash Flow Forecasting for SMEs: A Practical Step-by-Step Guide

    Cash Flow Forecasting for SMEs: A Practical Step-by-Step Guide

    Running out of cash while your profit and loss looks healthy is one of the most common — and most avoidable — crises facing small business owners. The culprit, more often than not, is the absence of a simple cash flow forecast. Unlike a profit and loss statement that tells you what you earned, a cash flow forecast tells you what you have — and when. For SME owners managing tight margins and unpredictable payment cycles, it may be the single most valuable financial tool you can build.

    What Is Cash Flow Forecasting?

    A cash flow forecast is a forward-looking estimate of when money will enter and leave your business over a defined period — typically the next 12 weeks, three months, or 12 months. It is not a P&L. It is not a budget. It is a living, rolling projection of your actual bank position at any given point in time.

    The forecast accounts for the timing of cash movements: when a customer actually pays an invoice, not just when it was raised; when a supplier is actually paid, not just when the cost was incurred. That distinction — timing — is what makes cash flow forecasting so powerful and so different from any other financial report.

    For a small business with, say, £20,000 in monthly costs, knowing you have £50,000 of invoices outstanding is reassuring — until you discover that none of them are due for 60 days, and your payroll runs in 12. A cash flow forecast surfaces that gap before it becomes a crisis.

    “Revenue is vanity, profit is sanity, cash is reality.” — This old finance adage endures because it is precisely true. A business can be profitable and still become insolvent. Cash flow forecasting is the tool that keeps reality in view.

    Cash Flow vs Profit: Why the Difference Matters

    Many business owners conflate profit with cash. They are related — but they are not the same thing, and treating them as interchangeable is a common and costly mistake.

    Profit is an accounting concept. It represents revenue minus expenses for a given period, calculated on an accruals basis. That means income is recognised when it is earned and costs when they are incurred, regardless of when actual money changes hands.

    Cash flow, by contrast, is entirely about movement. It records money in and money out — the actual bank debits and credits as they happen. Consider a business that invoices a client £10,000 in January but is not paid until March. The profit and loss shows the revenue in January. The cash flow statement shows the receipt in March. For two months, that £10,000 exists on paper only.

    Other factors that drive a wedge between profit and cash include capital expenditure (buying an asset reduces cash but is not immediately a P&L expense), loan repayments (repaying principal reduces cash but is not a P&L cost), and VAT collected on behalf of HMRC (it sits in your bank account but was never your money to spend).

    Understanding this distinction is covered in more depth in Accounting Basics: The Balance Sheet — Structure and Key Elements, which explains how assets, liabilities, and equity interact across your financial statements.

    How to Build a Simple Cash Flow Forecast

    You do not need sophisticated software to start forecasting. A spreadsheet — or even a piece of paper — will do. The structure is straightforward: opening balance, add expected cash inflows, subtract expected cash outflows, arrive at a closing balance. That closing balance becomes next month’s opening balance.

    The table below shows a simple three-month forecast for a fictional SME with predictable revenues and a known equipment purchase in Month 2:

    ItemMonth 1 (£)Month 2 (£)Month 3 (£)
    Opening Cash Balance12,00010,500-1,000
    Customer receipts22,00018,00025,000
    Other income (grants, interest)50000
    Total Inflows22,50018,00025,000
    Payroll & employer costs11,00011,00011,000
    Rent & utilities3,5003,5003,500
    Supplier payments6,5004,0005,000
    Equipment purchase011,0000
    VAT payment to HMRC3,00003,000
    Total Outflows24,00029,50022,500
    Closing Cash Balance10,500-1,0001,500

    Month 2’s closing balance of -£1,000 is a red flag — a projected overdraft. Without this forecast, the business owner might not realise the shortfall until payroll day arrives and the account is empty. With the forecast in hand, they have weeks to act: delay the equipment purchase, chase outstanding invoices, or arrange a short-term credit facility before the crisis hits.

    When building your own forecast, use your bank statements and sales pipeline as source data, not your P&L. Apply your actual payment terms — if customers typically pay 45 days after invoice, model the receipts accordingly. Be conservative with inflows and realistic with outflows.

    Common Cash Flow Traps — and How to Avoid Them

    Even businesses with a forecast can fall into predictable traps. Knowing them in advance is half the battle.

    Late-paying customers. The most common cash flow disruptor. If your payment terms are 30 days but your average debtor days run at 55, your forecast needs to reflect the reality, not the policy. Track your debtor days regularly and follow up on overdue invoices systematically. Consider early payment discounts or invoice financing if late payment is structural.

    Seasonal revenue gaps. Many businesses have predictable slow periods — retail slumps in January, construction pauses in winter, professional services quiet in August. Map your seasonal pattern and ensure your forecast extends far enough to capture the troughs. Build a cash buffer during strong months to carry you through weak ones.

    Overtrading. Growing faster than your working capital supports is a genuine risk. If you win a large new contract, you may need to pay suppliers and staff weeks before your client pays you. Forecast the cash impact of growth, not just the revenue. If you are curious about the different ways businesses raise working capital, Understanding Funding in Accounting: Shares, Debts, and Financing Options explains the landscape clearly.

    Forgetting non-monthly outflows. Annual insurance premiums, quarterly VAT payments, Corporation Tax, professional membership renewals — these are easy to forget when building a forecast. List every annual and irregular obligation at the start of the year and spread them into the relevant months.

    Treating the forecast as static. A forecast that is never updated is worse than no forecast at all — it gives false confidence. Review and update your forecast at least monthly, comparing actuals against projections and rolling it forward.

    Turning Your Forecast Into Action

    A cash flow forecast is only useful if it drives decisions. Here is how to make yours actionable:

    Set a minimum cash threshold — the floor below which your closing balance should never fall. For most SMEs, this is at least one month of fixed costs. If the forecast shows you approaching that floor, it triggers an immediate action review.

    Use your forecast to time major purchases. Capital expenditure, hiring decisions, or marketing campaigns should be modelled into the forecast before they are committed. If a purchase creates a dangerous cash trough, you can either defer it, phase it, or arrange financing in advance.

    Share a simplified version with your bank or accountant. Lenders are far more receptive to a facility request when it is supported by a well-constructed forecast showing the timing and recovery of a shortfall. It demonstrates management competence and reduces lending risk.

    Finally, as your business grows and you begin operating across multiple entities or locations, the complexity of cash forecasting increases. At that stage, having a clear consolidated picture of group finances becomes essential — not just individual entity forecasts, but a coherent group view.


    Key Takeaways

    • A cash flow forecast projects your actual bank balance over time — it is not a P&L or a budget.
    • Profit and cash are different. You can be profitable and still run out of money if the timing of receipts and payments does not align.
    • The basic structure is: Opening Balance + Cash Inflows − Cash Outflows = Closing Balance, rolled forward month by month.
    • Model inflows conservatively based on actual debtor payment behaviour, not your stated payment terms.
    • Include all irregular outflows — VAT, Corporation Tax, annual premiums — in the months they actually fall.
    • Review and update your forecast at least monthly, comparing actuals to projections.
    • Use the forecast to drive decisions: timing purchases, chasing debtors, and arranging finance before — not after — a crisis arrives.

    Related reading: If you are building your financial literacy alongside your forecasting skills, these posts are a useful next step. The Balance Sheet: Structure and Key Elements explains the financial statement that provides the context for your cash position. Why Every SME Owner Needs Basic Accounting Knowledge makes the case for financial literacy at every level of business ownership. Understanding Funding in Accounting walks through the options when your forecast reveals a shortfall that requires external finance. And for a grounding in the core terminology you will encounter across all these areas, Top 10 Accounting Terms Every Business Owner Should Know is the right place to start.

  • The Accounting Equation Explained: Assets = Liabilities + Equity

    The Accounting Equation Explained: Assets = Liabilities + Equity

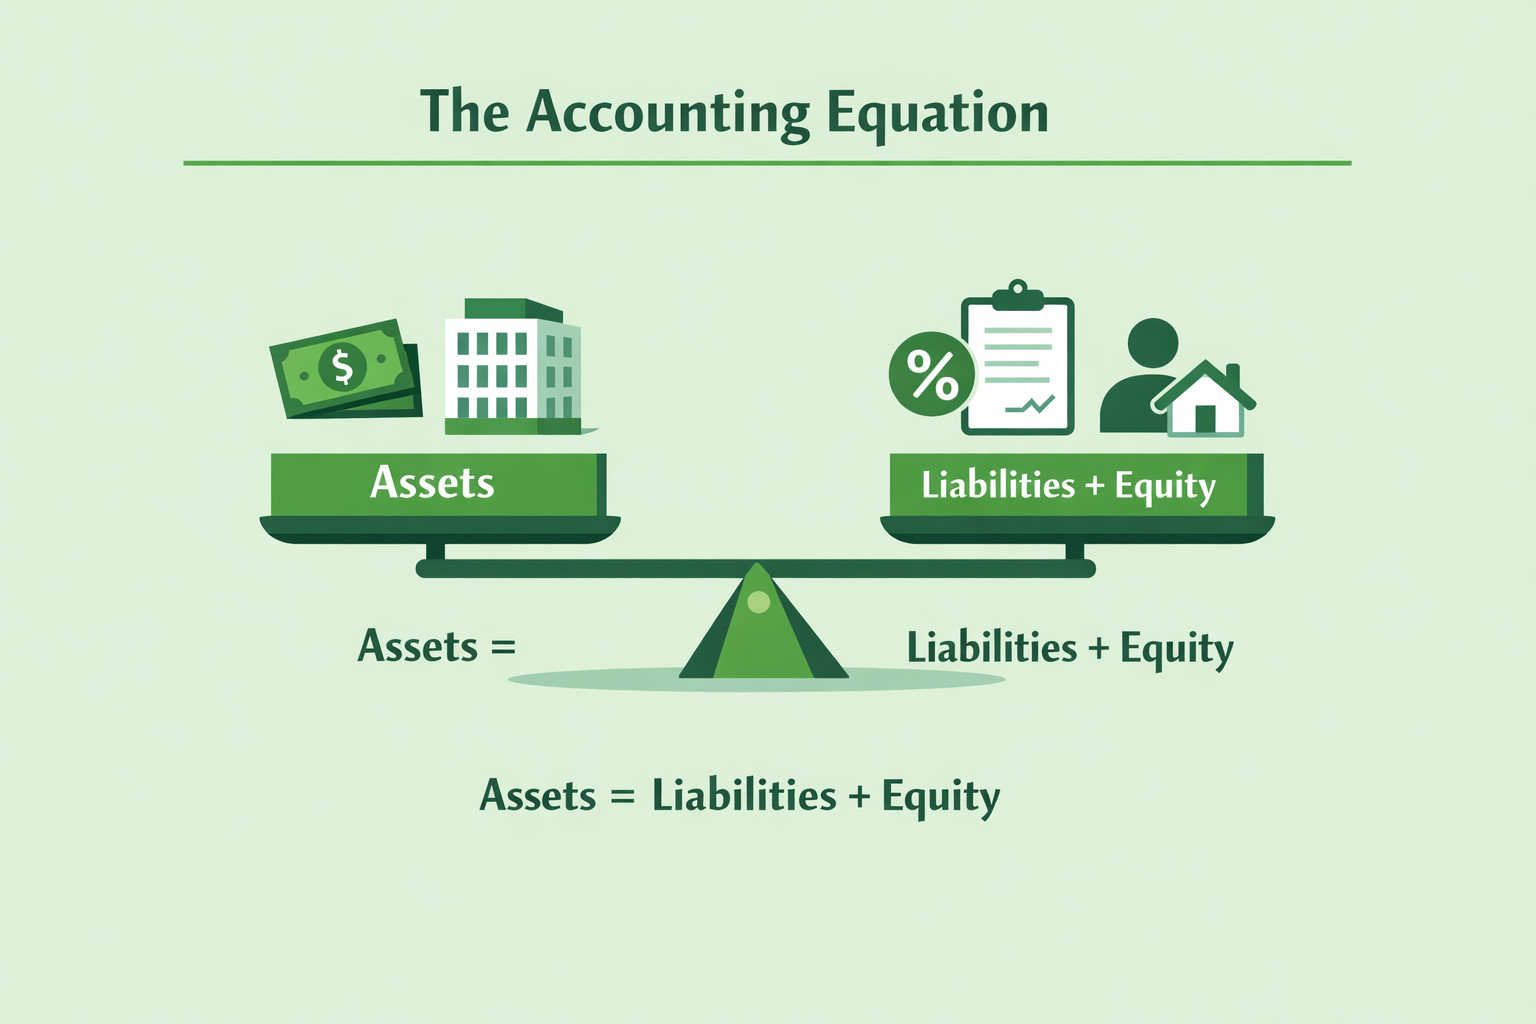
    At the heart of accounting lies one simple but powerful concept: Assets = Liabilities + Equity. This equation forms the foundation of all modern accounting systems, from small businesses keeping basic records to multinational corporations producing complex financial statements. While it may look like a simple formula, the accounting equation represents the complete financial structure of a business and explains how resources are funded and owned.

    For business owners and non-accountants, the accounting equation provides a clear framework for understanding financial health. It answers fundamental questions such as where the company’s resources come from, how much is owed to others, and how much truly belongs to the owners. Every transaction a business makes—whether it involves buying equipment, taking a loan, earning revenue, or paying expenses—affects this equation in some way.

    Understanding this equation is not just an academic exercise. It is essential for interpreting balance sheets, making informed decisions, and ensuring accurate financial records. Without grasping the accounting equation, financial statements can feel confusing or meaningless. With it, accounting becomes logical, structured, and much easier to understand. This article explains the accounting equation in detail, breaks down each component, and shows why it matters for everyday business operations.


    Understanding Assets

    Assets are the economic resources a business owns or controls that are expected to provide future benefits. In simple terms, assets are everything a business uses to operate and generate income. Common examples include cash, inventory, equipment, buildings, vehicles, and accounts receivable. Assets can also be intangible, such as trademarks, software, or goodwill.

    Assets are usually classified into current assets and non-current assets. Current assets are expected to be used or converted into cash within one year, such as cash, inventory, and receivables. Non-current assets are long-term resources, such as property, machinery, or long-term investments. This classification helps users of financial statements understand liquidity and long-term stability.

    From the accounting equation perspective, assets represent the left side of the equation and show what the business has at its disposal. However, assets do not exist on their own. Every asset must be financed either through borrowing (liabilities) or through owner investment and retained profits (equity). This is why assets are always equal to liabilities plus equity.

    Understanding assets helps business owners evaluate operational capacity, efficiency, and growth potential. A company with strong assets but weak cash flow, for example, may struggle to meet short-term obligations. Therefore, assets are not just about size, but about quality, liquidity, and usefulness in achieving business goals.


    Understanding Liabilities

    Liabilities represent the obligations or debts a business owes to external parties. These can include loans, accounts payable, taxes payable, overdrafts, and accrued expenses. Essentially, liabilities are claims on the business’s assets by creditors, suppliers, banks, and other third parties.

    Like assets, liabilities are classified into current liabilities and non-current liabilities. Current liabilities are obligations due within one year, such as supplier invoices, short-term loans, and tax liabilities. Non-current liabilities are long-term obligations, including bank loans, bonds, and lease liabilities. This classification helps assess the company’s short-term liquidity and long-term financial commitments.

    Within the accounting equation, liabilities explain where part of the assets came from. If a company buys equipment using a bank loan, the equipment becomes an asset, while the loan becomes a liability. The equation remains balanced because both sides increase by the same amount. This illustrates a key accounting principle: every transaction has at least two effects.

    For business owners, understanding liabilities is crucial for managing financial risk. Excessive liabilities can strain cash flow and limit future borrowing capacity. However, liabilities are not inherently bad. When managed responsibly, they can help businesses grow, expand operations, and improve returns. The key is understanding how liabilities fit into the overall financial structure and ensuring they remain sustainable.


    Understanding Equity

    Equity represents the owner’s residual interest in the business after liabilities are deducted from assets. In simple terms, equity is what belongs to the owners if all assets were sold and all liabilities were paid off. Equity includes owner contributions, share capital, retained earnings, and reserves.

    Equity increases when owners invest additional funds or when the business earns profits. It decreases when owners withdraw money or when the business incurs losses. Unlike liabilities, equity does not represent an obligation to repay external parties. Instead, it reflects ownership and long-term commitment to the business.

    In the accounting equation, equity explains the internal source of funding for assets. While liabilities represent borrowed funds, equity represents owner-funded resources. Together, liabilities and equity show how all assets are financed. This makes equity a critical measure of financial stability and long-term sustainability.

    For business owners, equity provides insight into value creation. Growing equity over time usually indicates a profitable and well-managed business. Investors and lenders closely examine equity levels to assess risk and financial strength. A business with strong equity is generally more resilient during economic downturns and better positioned for growth.

    Understanding equity helps business owners see beyond short-term performance and focus on long-term value. It connects daily operations, profitability, and strategic decisions to the overall financial health of the business.


    How the Accounting Equation Works in Practice

    The accounting equation remains in balance because every transaction affects at least two accounts. This is the foundation of double-entry accounting. For example, when a business purchases inventory with cash, one asset (inventory) increases while another asset (cash) decreases. The total assets remain the same, and the equation stays balanced.

    When a business takes out a loan, assets increase because cash is received, and liabilities increase because a loan is created. When the business earns revenue, assets increase through cash or receivables, and equity increases through retained earnings. When expenses are paid, assets decrease and equity decreases, reflecting reduced profitability.

    This constant balancing ensures accuracy and consistency in financial records. If the equation does not balance, it signals an error in recording transactions. This makes the accounting equation not only a conceptual tool but also a practical control mechanism.

    For non-accountants, understanding this logic demystifies accounting. Financial statements are no longer collections of unrelated numbers but structured representations of how assets are funded and owned. Once this relationship is understood, reading balance sheets and understanding business performance becomes far more intuitive.


    Why the Accounting Equation Matters for Business Owners

    The accounting equation is essential because it connects operations, financing, and ownership into one coherent framework. It helps business owners understand how daily decisions affect overall financial health. Buying assets, taking loans, earning profits, or paying expenses all influence the balance between assets, liabilities, and equity.

    For decision-making, the equation provides clarity. It shows whether growth is driven by profits or debt, whether the business is overleveraged, and how much value has been built over time. It also supports better communication with accountants, lenders, and investors by providing a shared financial language.

    Most importantly, the accounting equation turns accounting into a logical system rather than a mysterious one. Once business owners understand this equation, they gain confidence in interpreting financial statements, asking the right questions, and making informed decisions.


    Conclusion

    The accounting equation—Assets = Liabilities + Equity—is the backbone of accounting and financial reporting. While simple in appearance, it explains how every business is structured, funded, and owned. Assets show what the business controls, liabilities show what it owes, and equity shows what truly belongs to the owners.

    By understanding this equation, business owners gain a powerful lens through which to view financial information. It transforms accounting from a technical requirement into a practical management tool. Whether running a small business or planning future growth, mastering the accounting equation is a crucial step toward financial clarity, control, and long-term success.

  • Top 10 Accounting Terms Every Business Owner Should Know

    Top 10 Accounting Terms Every Business Owner Should Know

    Accounting doesn’t need to be complicated, but understanding the right terminology is essential for running a successful business. Whether you’re reviewing financial statements, speaking with your accountant, or making strategic decisions, knowing basic accounting terms helps you stay in control of your finances.

    This article explains the top 10 accounting terms every business owner should know, using simple language and real-world relevance.


    1. Revenue

    Revenue is the total income earned from selling goods or services before any expenses are deducted. It is often referred to as sales or turnover.

    Why it matters:
    Revenue shows how well your business is performing in the market, but it does not indicate profitability on its own.


    2. Expenses

    Expenses are the costs incurred to run the business, such as rent, salaries, utilities, marketing, and supplies.

    Why it matters:
    Controlling expenses is critical for improving profitability and maintaining cash flow.


    3. Profit (Net Income)

    Profit is what remains after all expenses are deducted from revenue. It reflects the true financial success of your business.

    Why it matters:
    Profit determines sustainability, growth potential, and returns to owners.


    4. Cash Flow

    Cash flow refers to the movement of cash in and out of the business during a period.

    Why it matters:
    A business can be profitable but still fail if it runs out of cash. Managing cash flow ensures the business can meet its obligations.


    5. Assets

    Assets are resources owned by the business that provide future economic benefits, such as cash, inventory, equipment, and property.

    Why it matters:
    Assets represent the strength and operational capability of your business.


    6. Liabilities

    Liabilities are obligations the business owes to others, including loans, accounts payable, and taxes owed.

    Why it matters:
    Understanding liabilities helps you manage debt and avoid financial risk.


    7. Equity

    Equity represents the owner’s interest in the business after liabilities are deducted from assets.

    Why it matters:
    Equity shows how much of the business truly belongs to the owner and reflects accumulated profits or losses.


    8. Accounts Receivable

    Accounts receivable refers to money owed to the business by customers who have purchased goods or services on credit.

    Why it matters:
    Monitoring receivables helps ensure timely collections and healthy cash flow.


    9. Accounts Payable

    Accounts payable refers to amounts the business owes to suppliers for goods or services purchased on credit.

    Why it matters:
    Managing payables helps maintain good supplier relationships and avoid late payment penalties.


    10. Balance Sheet

    The balance sheet is a financial statement that shows the business’s assets, liabilities, and equity at a specific point in time.

    Why it matters:
    It provides a snapshot of financial health and stability.


    Why These Accounting Terms Matter for Business Owners

    Understanding these terms allows business owners to:

    • Read financial reports confidently
    • Make informed financial decisions
    • Communicate effectively with accountants and bankers
    • Monitor business performance and risks

    Accounting knowledge is a powerful tool that supports growth and sustainability.


    Conclusion

    You don’t need to be an accountant to run a successful business, but you do need to understand the basics. These ten accounting terms form the foundation of financial literacy for business owners.

    By mastering these concepts, you gain better control over your finances, make smarter decisions, and build a stronger, more resilient business.

  • Accounting Made Simple: What It Is and Why It Matters

    Accounting Made Simple: What It Is and Why It Matters

    Accounting often feels intimidating, filled with numbers, rules, and unfamiliar terms. However, at its core, accounting is simply the language of business. It tells the story of where money comes from, how it is used, and what a business owns or owes.

    This guide breaks accounting down into simple concepts, explains why it matters, and shows how even basic accounting knowledge can make a big difference for individuals and businesses alike.


    What Is Accounting?

    Accounting is the process of recording, classifying, summarizing, and analyzing financial transactions. Its purpose is to provide clear and accurate information about financial performance and position.

    In simple terms, accounting helps answer questions such as:

    • Are we making money?
    • Where is the cash going?
    • Can we afford to grow?
    • Are we financially healthy?

    The Main Types of Accounting

    Financial Accounting

    Focuses on preparing financial statements for external users such as investors, lenders, and regulators.

    Management Accounting

    Provides internal reports to help management plan, control, and make decisions.

    Cost Accounting

    Tracks and analyzes costs related to production or service delivery.

    Tax Accounting

    Ensures compliance with tax laws and proper calculation of taxes owed.


    The Basic Accounting Equation

    At the heart of accounting is one simple rule:

    Assets = Liabilities + Equity

    • Assets: What the business owns
    • Liabilities: What the business owes
    • Equity: The owner’s interest in the business

    This equation ensures that every financial transaction is recorded in balance.


    Key Financial Statements Explained Simply

    Income Statement (Profit and Loss)

    Shows income, expenses, and profit over a period of time.

    Balance Sheet

    Shows what a business owns and owes at a specific date.

    Cash Flow Statement

    Tracks how cash moves in and out of the business.

    Together, these statements provide a complete picture of financial health.


    Why Accounting Matters

    1. Helps Track Business Performance

    Accounting shows whether a business is profitable and highlights trends in income and expenses.

    2. Improves Decision-Making

    With accurate financial data, decisions about pricing, expansion, hiring, or cost control become clearer.

    3. Supports Cash Flow Management

    Understanding cash flow prevents liquidity problems and helps plan for upcoming expenses.

    4. Ensures Legal and Tax Compliance

    Proper accounting records are essential for meeting tax obligations and regulatory requirements.

    5. Builds Trust with Stakeholders

    Investors, lenders, and partners rely on accurate financial information to assess risk and performance.


    Accounting for Individuals and Small Businesses

    Accounting is not just for large corporations. For individuals and small businesses, it helps with:

    • Budgeting and expense control
    • Understanding profitability
    • Planning savings and investments
    • Avoiding financial surprises

    Basic accounting knowledge empowers people to make smarter financial choices.


    Common Accounting Myths

    “Accounting Is Only About Numbers”

    In reality, accounting is about understanding what the numbers mean.

    “You Need to Be Good at Math”

    Accounting relies more on logic, structure, and consistency than advanced mathematics.

    “Small Businesses Don’t Need Accounting”

    Even the smallest businesses need accounting to survive and grow.


    Tools That Make Accounting Easier

    Modern tools simplify accounting significantly:

    • Cloud reporting software like BrizoSystem
    • Invoicing and expense tracking apps
    • Automated bank feeds and reports

    These tools reduce manual work and improve accuracy.


    How to Get Started with Accounting

    For beginners:

    1. Learn basic accounting terms
    2. Understand financial statements
    3. Track income and expenses consistently
    4. Use simple accounting software
    5. Review reports regularly

    Small steps can quickly build confidence and understanding.


    Conclusion

    Accounting doesn’t have to be complex. When broken down into simple concepts, it becomes a powerful tool for understanding financial health, making informed decisions, and building sustainable success.

    Whether you’re running a business or managing personal finances, accounting matters because it provides clarity, control, and confidence in handling money. Mastering the basics is one of the smartest investments you can make.

  • Why Every SME Owner Needs Basic Accounting Knowledge

    Why Every SME Owner Needs Basic Accounting Knowledge

    Running a small or medium-sized enterprise (SME) is an exciting journey, filled with opportunities, challenges, and decisions that can make or break the business. While most SME owners are experts in their industry or product, one area often overlooked is basic accounting knowledge.

    Understanding accounting is not just for finance professionals; it is a critical skill for any business owner. It provides the foundation for sound decision-making, growth planning, and financial sustainability.


    The Importance of Accounting for SMEs

    Accounting is the process of recording, summarizing, and analyzing financial transactions. For SMEs, basic accounting knowledge helps owners:

    • Track income and expenses
    • Understand profitability
    • Manage cash flow effectively
    • Meet tax and legal obligations
    • Make informed strategic decisions

    Without these skills, business owners risk poor financial planning, late payments, unexpected losses, or compliance issues.


    Key Reasons SME Owners Should Learn Accounting

    1. Monitor Cash Flow

    Cash flow is the lifeblood of any SME. Even profitable businesses can fail if they run out of cash. Knowing how to read cash flow statements, track receivables, and forecast expenses helps owners avoid liquidity problems.

    Example: Identifying slow-paying customers early can prevent cash shortages.


    2. Understand Profitability

    Accounting knowledge allows SME owners to separate revenue from profit. By analyzing profit and loss statements, owners can determine which products, services, or clients are most profitable, enabling better business decisions.

    Example: Cutting underperforming product lines or optimizing pricing strategies.


    3. Make Informed Decisions

    Every business decision—hiring, investing, expanding—has a financial impact. Understanding basic accounting ensures decisions are backed by data rather than guesswork.

    Example: Evaluating whether to take a loan to expand operations by reviewing projected interest, repayment schedules, and cash flow impact.


    4. Maintain Compliance

    SMEs must comply with tax laws, financial reporting standards, and other regulatory requirements. Basic accounting skills help owners prepare accurate records, file taxes correctly, and avoid penalties.

    Example: Properly documenting expenses ensures deductible items are claimed without risking audits.


    5. Communicate with Stakeholders

    Investors, banks, and business partners rely on financial information to make decisions. SME owners with accounting knowledge can interpret reports confidently and communicate financial performance clearly.

    Example: Presenting financial statements to secure a bank loan or attract investors.


    6. Reduce Dependence on Outsourcing

    While hiring an accountant is important, owners with basic accounting knowledge can:

    • Review financial statements effectively
    • Detect errors or fraud
    • Ensure their accountants are working efficiently

    This reduces reliance on external professionals and improves financial control.


    Basic Accounting Skills Every SME Owner Should Learn

    1. Reading Financial Statements – Balance sheet, income statement, cash flow statement
    2. Bookkeeping Fundamentals – Recording sales, purchases, payments, and receipts
    3. Budgeting & Forecasting – Planning future revenue, costs, and cash flow
    4. Understanding Key Ratios – Profit margin, current ratio, debt-to-equity ratio
    5. Tax Basics – Knowing taxable income, deductions, and deadlines

    Tools to Help SME Owners

    Several tools can simplify accounting for SME owners:

    • Cloud Accounting Software – QuickBooks, Xero, or BrizoSystem
    • Expense Tracking Apps – Zoho Expense, Expensify
    • Spreadsheet Templates – For manual tracking of income, expenses, and cash flow

    Even basic knowledge combined with simple tools can significantly improve financial management.


    Conclusion

    Accounting may seem daunting for many SME owners, but basic knowledge is essential. It empowers owners to:

    • Make informed decisions
    • Monitor financial health
    • Ensure compliance
    • Communicate effectively with stakeholders

    Ultimately, a small investment in learning accounting can lead to better business performance, growth, and sustainability. SME owners who embrace financial literacy gain a competitive advantage that goes far beyond numbers—they gain control over their business destiny.