
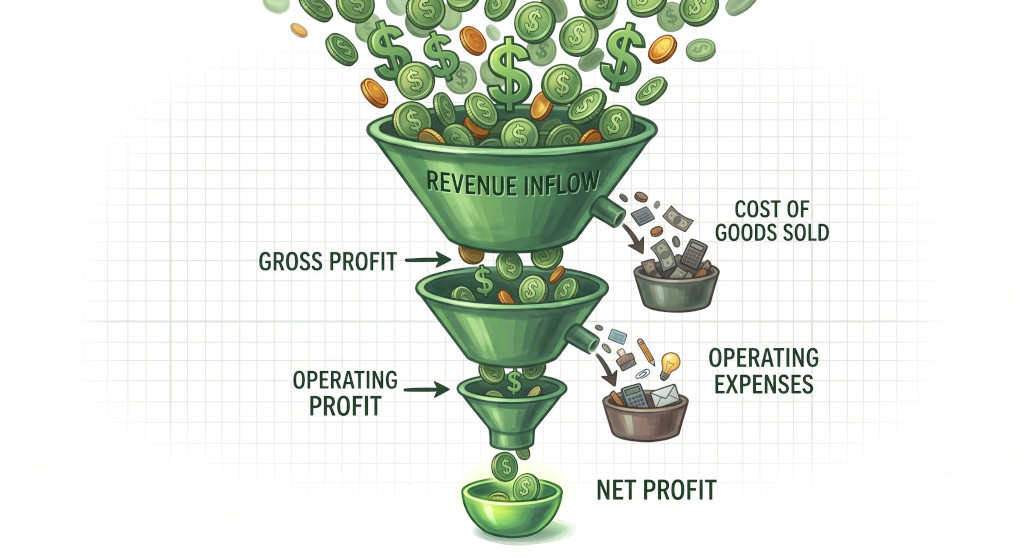
Two businesses each report £500,000 in annual revenue. One is thriving; the other is quietly struggling. The difference doesn’t show up in the top line — it shows up in the margins. Profit margins are among the most powerful diagnostic tools in accounting, revealing not just whether a business is making money but where that money is being made (or lost) and how efficiently it is being converted from revenue into actual profit. Understanding the difference between gross, operating, and net profit margin is essential for any business owner who wants to genuinely understand their financial performance.
What Is a Profit Margin?
A profit margin expresses profit as a percentage of revenue. Rather than looking at profit in absolute terms — “we made £50,000 this year” — a margin lets you assess profitability relative to the size of the business and compare performance across different periods, businesses, and industries.
There are three profit margins that matter most, each calculated from a different line on the income statement:
- Gross profit margin — measures how efficiently you produce or source what you sell
- Operating profit margin — measures how well you manage the full cost of running the business
- Net profit margin — measures the ultimate bottom-line return after all costs, interest, and tax
Each one peels back a different layer of cost, and together they tell a much richer story than any single profit figure on its own.
Revenue tells you the size of your business. Profit tells you whether it makes money. Margin tells you how efficiently it converts one into the other — and that’s the number that really matters when comparing performance over time or against competitors.
Gross Profit Margin
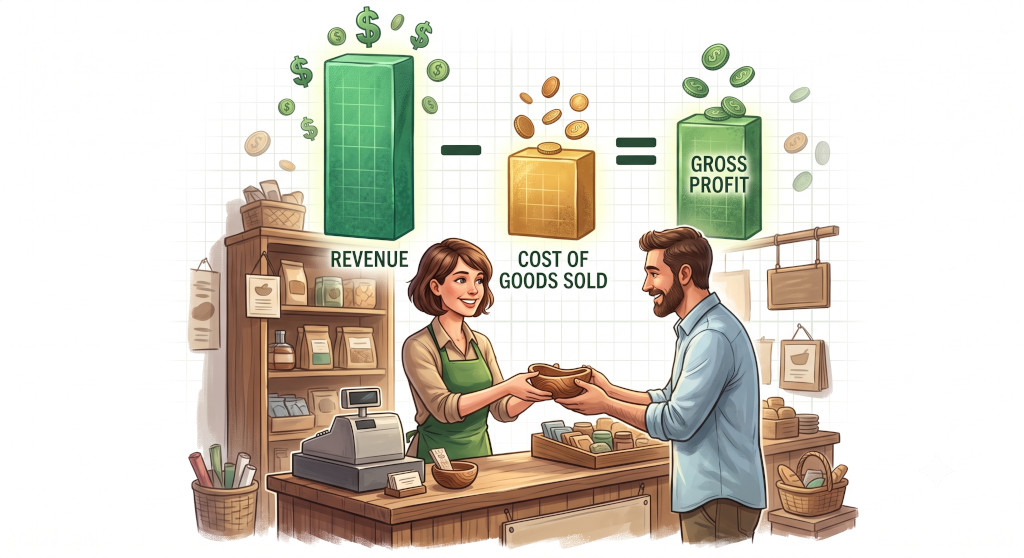
Gross profit is revenue minus the cost of goods sold (COGS) — the direct costs of producing or purchasing what you sell. For a manufacturer, COGS includes raw materials, direct labour, and production overheads. For a retailer, it’s the wholesale cost of the stock sold. For a service business, it typically includes the direct labour and materials consumed in delivering the service.
Gross profit margin = (Gross profit ÷ Revenue) × 100
If your business generates £500,000 in revenue and your COGS is £300,000, your gross profit is £200,000 and your gross margin is 40%.
The gross margin tells you how much of every pound of revenue is left after covering the direct cost of what you sold. That remaining amount is what you have available to cover all your other overheads, pay your interest and tax, and deliver a return to owners. A falling gross margin is usually a signal that either your input costs are rising, your pricing is slipping, or your product mix is shifting toward lower-margin lines.
Gross margins vary enormously by industry. A supermarket might operate on gross margins of 25–30%. A software company might achieve 70–80%. A professional services firm might be above 50%. What matters most is not the absolute number but the trend over time and how it compares to others in the same sector.
Operating Profit Margin
Operating profit — sometimes called EBIT (earnings before interest and tax) — deducts all operating expenses from gross profit. This includes everything it costs to run the business day-to-day that isn’t directly tied to production: rent, salaries, utilities, insurance, depreciation, marketing, and administrative costs.
Operating profit margin = (Operating profit ÷ Revenue) × 100
Continuing the example: if gross profit is £200,000 and total operating expenses are £120,000, operating profit is £80,000 and the operating margin is 16%.
The operating margin is arguably the most important of the three for assessing the underlying health of a business, because it strips out the effects of how the business is financed (interest) and the tax environment it operates in. It reflects the core commercial efficiency — how well management is converting revenue into profit through the combination of pricing, cost control, and operational leverage.
A business with a high gross margin but a low operating margin has a cost structure problem — overheads are consuming the gross profit before it can become earnings. A business with a stable operating margin year-on-year is demonstrating good cost discipline even as revenue fluctuates.
Net Profit Margin
Net profit is what remains after deducting interest on debt and corporation tax from operating profit. It is the bottom line — the final measure of what the business actually earned for its owners in the period.
Net profit margin = (Net profit ÷ Revenue) × 100
If operating profit is £80,000, interest charges are £8,000, and the corporation tax liability is £18,000, net profit is £54,000 and the net margin is 10.8%.
The net margin is the most comprehensive measure of profitability, but it is also the most susceptible to factors that aren’t directly related to operational performance — the level of debt (which determines interest charges), the tax jurisdiction, and one-off items such as asset disposals or restructuring costs. Two businesses with identical operations could have very different net margins purely because one carries significant debt and the other is equity-funded.
For this reason, analysts and investors often focus on operating margin for comparing like-for-like performance and use net margin as the final check on overall financial health after accounting for capital structure and tax.
Worked Example — Halston Kitchens Ltd
Halston Kitchens Ltd designs and installs bespoke fitted kitchens for residential and commercial clients. Here is a summary of the company’s income statement for the year ended 31 December, alongside the calculated margins.
| Income Statement Item | £ | Margin |
|---|---|---|
| Revenue | 620,000 | 100% |
| Cost of goods sold (materials + direct labour) | (248,000) | |
| Gross Profit | 372,000 | 60.0% |
| Salaries and wages (non-direct) | (115,000) | |
| Rent and utilities | (42,000) | |
| Depreciation | (18,000) | |
| Marketing and other overheads | (31,000) | |
| Operating Profit (EBIT) | 166,000 | 26.8% |
| Interest on bank loan | (12,000) | |
| Corporation tax | (38,500) | |
| Net Profit | 115,500 | 18.6% |
Reading across the three margins tells a clear story. Halston’s 60% gross margin is strong — materials and direct labour account for only 40% of revenue, suggesting good pricing power and controlled input costs. The operating margin of 26.8% shows that overheads are well managed relative to the scale of the business. The gap between gross and operating margin (33.2 percentage points) represents the overhead burden — reasonable for a business of this type. The net margin of 18.6% is healthy after interest and tax, indicating that the debt load is manageable and the business is genuinely profitable at the bottom line.
Using Margins to Diagnose Business Performance

The real power of profit margins comes from tracking them over time and asking the right questions when they move.
Gross margin falling? Check whether input costs have risen (supplier price increases, higher wages for direct staff), whether selling prices have been discounted, or whether the product mix has shifted toward lower-margin lines. This is often the first warning sign of a pricing or procurement problem.
Operating margin shrinking despite a stable gross margin? Overheads are growing faster than revenue. Common causes include staff headcount that has outpaced sales growth, rising rent or energy costs, or marketing spend that isn’t converting to revenue. This points to a scalability or cost-control issue rather than a pricing problem.
Net margin low despite a healthy operating margin? The business may be carrying too much debt (high interest charges) or facing an above-average tax burden. This is a capital structure question rather than an operational one.
Margins are most useful when compared against your own prior periods (to spot trends), your budget (to spot variances), and industry benchmarks (to assess competitive position). Our post on financial ratios explained covers a broader set of profitability and efficiency metrics that complement margin analysis.
Key Takeaways
- Gross profit margin = (Gross profit ÷ Revenue) × 100. It measures how efficiently you produce or source what you sell, after direct costs only.
- Operating profit margin = (Operating profit ÷ Revenue) × 100. It measures core business efficiency after all operating costs, excluding interest and tax.
- Net profit margin = (Net profit ÷ Revenue) × 100. It is the final bottom-line return after all costs, interest, and tax — the most comprehensive but most susceptible to non-operational factors.
- A falling gross margin usually signals a pricing or cost-of-goods problem. A falling operating margin with a stable gross margin usually signals an overhead problem. A low net margin with a healthy operating margin usually signals a debt or tax issue.
- Margins are most valuable when tracked over time and compared against budget and industry benchmarks — not just read as a one-off snapshot.
Related reading: If you found this guide useful, you may also want to read our posts on understanding the income statement, financial ratios explained, break-even analysis explained, and understanding the balance sheet.


[…] detailed breakdown of how gross, operating, and net margins relate to each other, the post on profit margins explained covers each in […]