
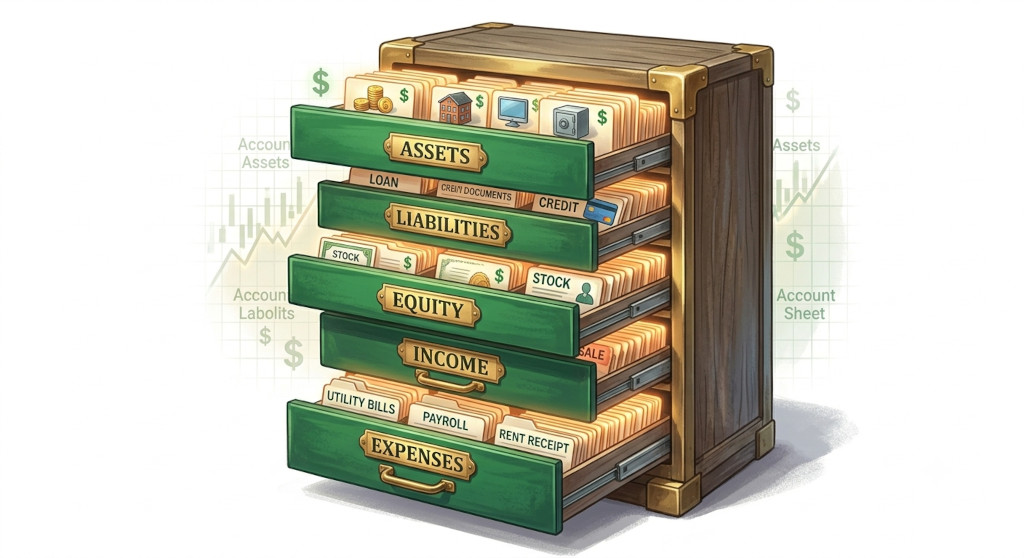
Before your accounting software can record a single transaction, it needs to know where to put it. That’s the job of the chart of accounts — the master list of every category your business uses to organise its financial activity. Get it right at the start and your reports are clean, your tax returns are straightforward, and your financial statements tell a coherent story. Get it wrong and you spend years fighting messy data, duplicate categories, and reports that are impossible to interpret. For small business owners setting up accounting for the first time, the chart of accounts is the single most important structural decision you’ll make.
What Is a Chart of Accounts?
A chart of accounts (often abbreviated to COA) is a structured list of all the accounts — or categories — that a business uses to record its financial transactions in the general ledger. Every time money moves, every time an invoice is raised, every time a bill is paid, the transaction is assigned to one of these accounts. The chart of accounts is the skeleton on which your entire financial reporting system is built.
Each account in the chart has a name (e.g. “Office Rent”) and typically a unique numeric code (e.g. 5100) that identifies its position in the structure. The numbering system isn’t just cosmetic — it groups accounts logically by type, making it easier to navigate and to produce accurate financial statements.
Think of a chart of accounts as the index of your business’s financial story. Every transaction that ever happens gets filed under one of its headings. If the index is well-designed, finding information and producing reports is effortless. If the index is chaotic, everything downstream becomes harder.
Most accounting software — Xero, QuickBooks, MYOB, Sage — comes with a default chart of accounts that you can customise. The default is a starting point, not a finished product. Taking the time to tailor it to your business will pay dividends in reporting clarity for years to come.
The Five Main Account Categories

Every account in a chart of accounts belongs to one of five categories. These five categories map directly to the financial statements your business produces — assets, liabilities, and equity feed the balance sheet, while income and expenses feed the income statement.
| Category | What It Includes | Financial Statement | Normal Balance |
|---|---|---|---|
| Assets | What the business owns — cash, receivables, inventory, equipment, property | Balance Sheet | Debit |
| Liabilities | What the business owes — trade payables, loans, tax owed, accrued expenses | Balance Sheet | Credit |
| Equity | Owner’s capital, retained earnings, share capital, dividends drawn | Balance Sheet | Credit |
| Income | Revenue from sales, service fees, interest received, other income | Income Statement | Credit |
| Expenses | All costs of running the business — COGS, wages, rent, marketing, depreciation | Income Statement | Debit |
The numbering convention for account codes most commonly assigns ranges to each category: 1000–1999 for assets, 2000–2999 for liabilities, 3000–3999 for equity, 4000–4999 for income, and 5000–5999 (or higher) for expenses. This means that just by glancing at an account code, you immediately know which part of the financial statements it relates to.
How to Structure Your Chart of Accounts
A well-structured chart of accounts is specific enough to give you useful reporting but not so granular that it becomes unwieldy. The right level of detail depends on the size and complexity of your business — a sole trader with ten revenue lines needs a very different COA to a manufacturer with multiple product categories and departments.
Start with your reporting needs. Before adding any account, ask: “Will I want to see this as a separate line in my financial reports?” If the answer is no — if you’d always combine it with something else — it doesn’t need its own account. Many businesses over-engineer their COA at the start and end up with hundreds of accounts that make reports cluttered and difficult to read.
Group sensibly within categories. Within the expenses section, for instance, it helps to cluster related costs together using your numbering system. Staff costs might run from 5100–5199, premises costs from 5200–5299, and so on. This makes it much easier to build summary reports that show total staff costs or total premises costs without having to manually select individual accounts.
Leave gaps in your numbering. Don’t number accounts 5101, 5102, 5103 consecutively. Use 5100, 5110, 5120 — this gives you room to insert new accounts in the right place later without disrupting the logical structure.
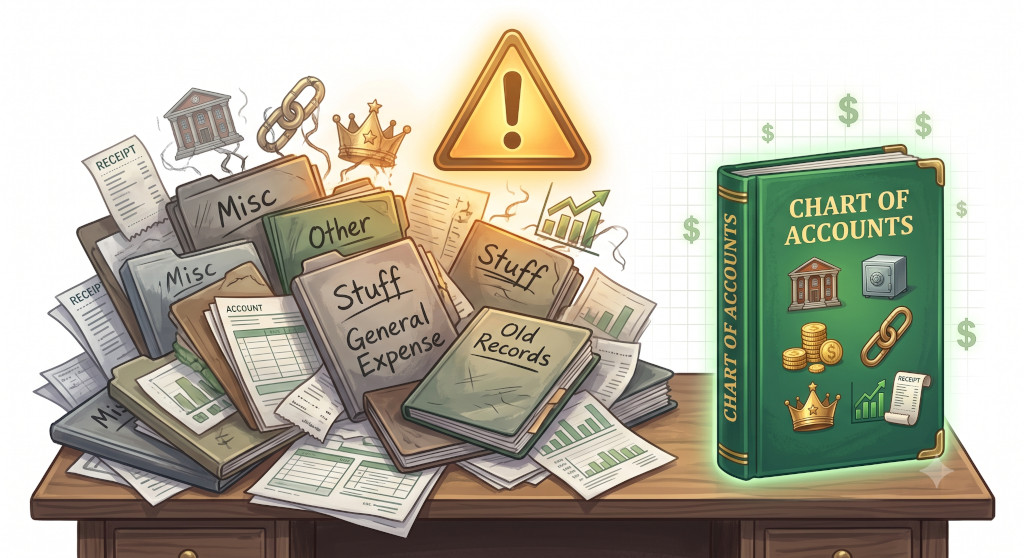
Avoid “miscellaneous” or “other” catch-all accounts. These are the enemy of clear reporting. If you find yourself posting frequently to a miscellaneous account, that’s a signal that the account belongs in the chart with a proper name. Catch-all accounts make it impossible to analyse what you’ve actually spent.
Keep income streams separate. If your business has more than one revenue stream — say, product sales, service fees, and rental income — each should have its own income account. This lets you see which parts of the business are growing, which are shrinking, and where your margin is strongest.
Sample Chart of Accounts — Clearwater Consulting Ltd
Clearwater Consulting Ltd is a professional services firm providing financial advisory and training services. Below is a simplified but realistic chart of accounts for a business of this type.
| Code | Account Name | Category |
|---|---|---|
| ASSETS | ||
| 1010 | Current Account — Main | Asset |
| 1020 | Savings / Reserve Account | Asset |
| 1100 | Trade Receivables (Debtors) | Asset |
| 1110 | Allowance for Doubtful Debts | Asset (contra) |
| 1200 | Prepaid Expenses | Asset |
| 1500 | Office Equipment (at cost) | Asset |
| 1510 | Accumulated Depreciation — Equipment | Asset (contra) |
| LIABILITIES | ||
| 2100 | Trade Payables (Creditors) | Liability |
| 2200 | Accrued Expenses | Liability |
| 2300 | VAT Payable | Liability |
| 2400 | Corporation Tax Payable | Liability |
| 2500 | Bank Loan | Liability |
| EQUITY | ||
| 3100 | Share Capital | Equity |
| 3200 | Retained Earnings | Equity |
| 3300 | Dividends Paid | Equity |
| INCOME | ||
| 4100 | Advisory Services Revenue | Income |
| 4200 | Training & Workshop Revenue | Income |
| 4300 | Retainer Fees | Income |
| 4900 | Other Income | Income |
| EXPENSES | ||
| 5100 | Salaries and Wages | Expense |
| 5110 | Employer NIC | Expense |
| 5120 | Pension Contributions | Expense |
| 5200 | Office Rent | Expense |
| 5210 | Utilities | Expense |
| 5300 | Subcontractor Costs | Expense |
| 5400 | Marketing and Advertising | Expense |
| 5500 | Software Subscriptions | Expense |
| 5510 | IT and Equipment Maintenance | Expense |
| 5600 | Professional Fees (legal, accounting) | Expense |
| 5700 | Travel and Subsistence | Expense |
| 5800 | Depreciation | Expense |
| 5900 | Bank Charges and Interest | Expense |
Notice several things about this structure. Income is split by service type (advisory, training, retainers) so Clearwater can immediately see which revenue stream is performing. Staff costs are grouped together in the 5100 range. The contra accounts (1110 for doubtful debts, 1510 for accumulated depreciation) sit directly beneath their parent accounts, making the relationship clear. And “Other Income” (4900) exists as a safety valve — but because all genuine income streams have their own accounts, very little should ever land in 4900.
Common Mistakes to Avoid
Too many accounts. Every account you add is another line to maintain, another place where transactions can be posted incorrectly. Start lean and add accounts only when you can articulate a specific reporting reason for them.
Mixing personal and business transactions. This is a bookkeeping problem first, but it’s often made worse by not having a clear “Owner Drawings” or “Director’s Loan” account. Without a designated account for personal withdrawals, they end up scattered across expense accounts, distorting your cost analysis.
Using vague account names. “General Expenses”, “Sundry Costs”, and “Miscellaneous” tell you nothing. If a transaction genuinely doesn’t fit anywhere, that’s a signal to create a new specific account, not to lump it in a catch-all.
Never reviewing or cleaning up the COA. A chart of accounts set up in year one often has accounts that are no longer relevant by year three. Periodic reviews — removing unused accounts, renaming ambiguous ones, archiving obsolete codes — keep your system clean and your reports meaningful.
Confusing balance sheet and income statement accounts. A common error is posting a capital asset purchase to an expense account. This understates profit and overstates costs in the period, and the balance sheet will not reflect the asset. Our post on capital vs revenue expenditure covers the boundary between these two categories in detail.
Key Takeaways
- A chart of accounts is the master list of categories your business uses to organise every financial transaction. It is the foundation of your entire accounting system.
- All accounts belong to one of five categories: assets, liabilities, equity, income, and expenses. Assets and liabilities feed the balance sheet; income and expenses feed the income statement.
- Use a numeric coding system with logical groupings and gaps between codes so you can insert new accounts without disrupting the structure.
- Keep your COA lean — add accounts only when you have a clear reporting reason. Catch-all “miscellaneous” accounts undermine the value of your financial reports.
- Separate your income streams into distinct accounts so you can analyse performance by revenue type, not just in aggregate.
- Review your chart of accounts annually — remove unused accounts, clarify ambiguous names, and make sure the structure still reflects how your business actually operates.
Related reading: If you found this guide useful, you may also want to read our posts on double-entry bookkeeping explained, trial balance explained, capital vs revenue expenditure, and understanding the balance sheet.




[…] your accounts are structured, it helps to start with a solid foundation — a well-organised chart of accounts for your SME makes it much easier to code transactions correctly and spot mismatches […]