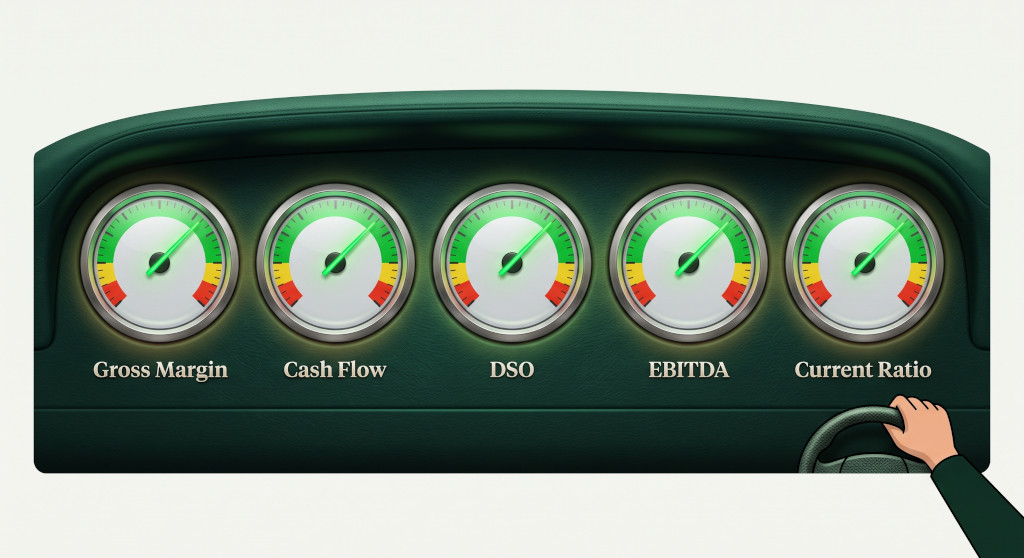
A finance team that reports numbers without tracking the right numbers is working hard in the wrong direction. Key performance indicators — KPIs — are the small set of metrics that tell you, at a glance, whether the business is financially healthy, whether it is moving in the right direction, and where to direct attention before small problems become expensive ones. But the world of financial metrics is enormous, and tracking everything means prioritising nothing. The finance teams that have the most impact are the ones who have made deliberate choices about which handful of KPIs genuinely reflect the business they are running — and who review those KPIs consistently, not just when something looks wrong.
What Makes a Good Financial KPI?
Not every metric is a KPI. A KPI should be tied to a decision or an action — if you cannot point to something you would do differently based on how this number moves, it is information, not a key performance indicator. A useful financial KPI is:
- Linked to business outcomes. It reflects something that genuinely affects profitability, solvency, or growth.
- Measurable consistently. You can calculate it the same way every month, making trend analysis meaningful.
- Actionable. When it moves in the wrong direction, there is something you can actually do about it.
- Timely. It can be produced quickly enough to act on — a KPI that takes three weeks to calculate loses its value.
With that standard in mind, financial KPIs tend to fall into three families: profitability, liquidity and cash flow, and operational efficiency. A well-rounded finance dashboard typically draws from all three.
Profitability KPIs
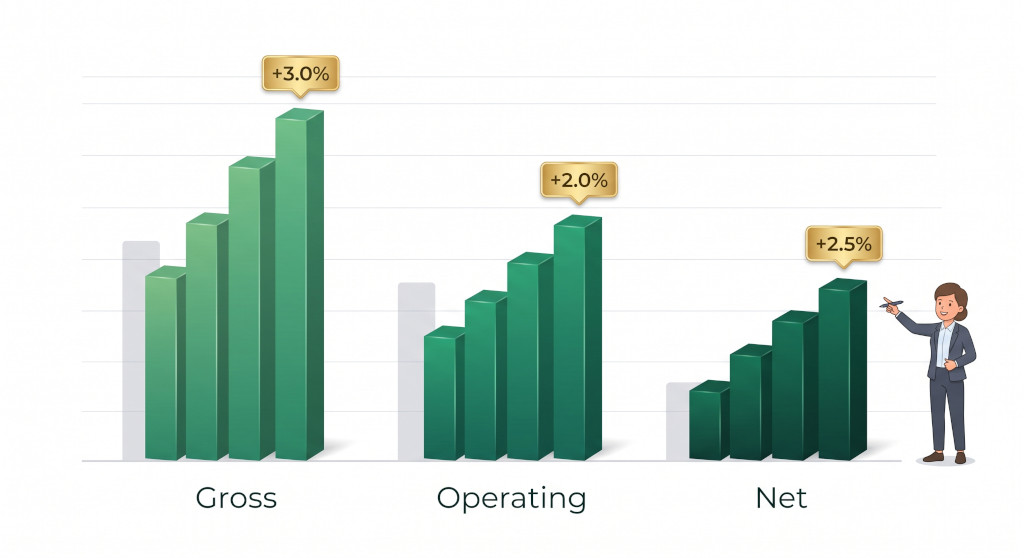
Profitability KPIs answer the most fundamental question in business: are we actually making money, and how much of each pound of revenue are we keeping?
Gross Margin
Gross margin is revenue minus cost of goods sold (COGS), expressed as a percentage of revenue. It tells you how efficiently the business generates profit from its core activity before overhead is considered. A business with a 45% gross margin keeps 45p from every £1 of sales to cover its operating costs and generate profit.
Formula: (Revenue − COGS) ÷ Revenue × 100
Gross margin is particularly important to track month by month because it is highly sensitive to pricing changes, input cost increases, and product mix shifts. A declining gross margin is often the first warning sign of a pricing or cost problem.
Operating Profit Margin (EBIT Margin)
Operating profit margin takes gross profit and deducts operating expenses — salaries, rent, marketing, depreciation — to show how much profit the business generates from its operations before interest and tax. It answers the question: is the business model fundamentally viable?
Formula: Operating Profit ÷ Revenue × 100
Net Profit Margin
Net profit margin is the bottom line — what is left after all expenses, interest, and tax. It is the most complete measure of profitability, though it can be distorted by one-off items and financing decisions. For a detailed breakdown of how gross, operating, and net margins relate to each other, the post on profit margins explained covers each in full.
EBITDA
Earnings before interest, tax, depreciation, and amortisation (EBITDA) is widely used as a proxy for operating cash generation — it strips out the accounting effects of capital structure and non-cash charges to show the underlying earnings power of the business. It is especially useful for comparing businesses with different asset bases or financing arrangements, and is often the metric investors and lenders focus on.
Track gross margin monthly and net margin quarterly. Gross margin moves fast and signals operational issues early; net margin gives the full picture but changes more slowly. If your gross margin is healthy and your net margin is thin, the problem is overhead — and that is a different conversation to have.
Liquidity and Cash Flow KPIs
A profitable business can still run out of cash. Liquidity KPIs measure whether the business can meet its short-term obligations — they are the vital signs that tell you whether the business will still be operating next quarter.
Current Ratio
The current ratio compares current assets (cash, receivables, inventory) to current liabilities (payables, short-term debt). A ratio above 1.0 means the business has more short-term assets than short-term obligations — a healthy position. A ratio below 1.0 is a warning sign.
Formula: Current Assets ÷ Current Liabilities
For most SMEs, a current ratio between 1.5 and 3.0 is considered healthy. A very high current ratio (above 4 or 5) may indicate that too much cash is sitting idle rather than being deployed productively.
Cash Runway
Cash runway is the number of months the business could continue operating at its current burn rate if no new revenue came in. It is the single most important KPI for early-stage businesses and for any business going through a difficult period.
Formula: Cash Balance ÷ Monthly Net Cash Outflow
Operating Cash Flow to Revenue
This ratio compares cash generated from operations to total revenue. It shows how efficiently the business converts sales into actual cash — a crucial distinction for businesses where revenue is recognised before cash is received. A business with strong revenue but weak operating cash flow may have a collection problem, an inventory build-up, or a mismatch between when it pays its suppliers and when it collects from customers.
Efficiency KPIs

Efficiency KPIs measure how well the business manages the assets and processes that convert inputs into outputs. They tend to be expressed in days, which makes them intuitive and easy to track over time.
Days Sales Outstanding (DSO)
DSO measures the average number of days it takes to collect payment after making a sale. A low DSO means you are collecting quickly; a high or rising DSO means cash is being tied up in unpaid invoices.
Formula: (Accounts Receivable ÷ Revenue) × Number of Days in Period
For a business with 30-day payment terms, a DSO of 45 or above is worth investigating — it suggests customers are paying late, or that collection processes need tightening.
Days Payable Outstanding (DPO)
DPO is the flip side of DSO: it measures the average number of days the business takes to pay its own suppliers. A higher DPO generally improves cash flow (you hold onto cash longer), but an excessively high DPO can damage supplier relationships and, for some businesses, result in late payment penalties.
Formula: (Accounts Payable ÷ COGS) × Number of Days in Period
Cash Conversion Cycle (CCC)
The cash conversion cycle combines DSO, DPO, and Days Inventory Outstanding (DIO) into a single measure of how long it takes to turn raw investment (purchasing inventory or starting a project) into cash received from customers. A shorter CCC means a healthier, more efficient business.
Formula: DIO + DSO − DPO
Revenue per Employee
A useful productivity indicator, particularly for service businesses. It shows how much revenue each employee (or full-time equivalent) generates, and is worth tracking as the team grows to ensure that headcount is scaling in line with output.
A Reference KPI Dashboard for SMEs
The following table summarises a practical starting set of KPIs for a typical SME finance team, with suggested review frequencies:
| KPI | What It Measures | Review Frequency | Healthy Benchmark (general guide) |
|---|---|---|---|
| Gross Margin | Core profitability before overhead | Monthly | Varies by industry; track trend |
| Operating Profit Margin | Profitability after operating costs | Monthly | 10–20% is healthy for most SMEs |
| Net Profit Margin | Bottom-line profitability | Monthly | Positive and stable/growing |
| EBITDA | Underlying earnings power | Monthly | Positive; compare to prior periods |
| Current Ratio | Short-term liquidity | Monthly | 1.5–3.0 |
| Cash Runway | Survival horizon | Monthly | >6 months comfort zone |
| Days Sales Outstanding (DSO) | Collection speed | Monthly | Close to stated payment terms |
| Days Payable Outstanding (DPO) | Supplier payment timing | Monthly | In line with supplier terms |
| Cash Conversion Cycle | Overall working capital efficiency | Quarterly | As short as possible; track trend |
| Revenue per Employee | Productivity / headcount efficiency | Quarterly | Stable or improving as team grows |
The benchmarks above are illustrative starting points — every industry has its own norms, and every business has its own history. The most important benchmark for any KPI is your own prior period: is this metric improving or deteriorating over time? That question is more useful than any external comparison.
Building a clean monthly management report that surfaces these KPIs consistently — alongside a brief narrative explanation of significant movements — is one of the highest-value activities a finance team can undertake. For guidance on how management accounts differ from statutory accounts and what a monthly finance pack typically contains, the post on management accounts vs statutory accounts is a useful companion read.
Key Takeaways
- A KPI is only useful if it is linked to a decision — if you cannot act on a metric, it is data, not a key performance indicator.
- Profitability KPIs (gross margin, operating margin, net margin, EBITDA) tell you whether the business is making money and how efficiently.
- Liquidity KPIs (current ratio, cash runway, operating cash flow to revenue) tell you whether the business can survive in the short term.
- Efficiency KPIs (DSO, DPO, cash conversion cycle) tell you how well the business manages its working capital and turns revenue into cash.
- Track gross margin monthly — it moves fast and gives early warning of pricing or cost problems.
- The most meaningful benchmark for most KPIs is your own prior period trend, not an industry average.
- A concise monthly KPI dashboard, shared with management alongside a brief narrative, is one of the highest-value outputs a finance team can produce.
Related Reading
- Key Financial Ratios Explained: A Complete Guide to Liquidity, Profitability and Efficiency
- Gross, Operating, and Net Profit Margin: What They Mean and Why They Matter
- Understanding the Cash Flow Statement: Your Business’s Financial Pulse
- Management Accounts vs Statutory Accounts: What’s the Difference and Why It Matters